
Server logs are where bugs confess. The problem is that nobody reads them until something catches fire. A production Nginx server can generate 50,000 lines per hour. Sifting through that manually is like reading a novel written in stack traces. What if Claude could read your logs, spot the anomalies, and tell you exactly what went wrong — with a suggested fix?
In this tutorial, you'll build a Python CLI tool that pipes raw log files into Claude's API via EzAI, gets back structured incident reports, and optionally streams the analysis in real time. The whole thing fits in under 120 lines of code.
What You'll Build
A command-line log analyzer that does three things:
- Ingests any text log file (Nginx, Django, systemd, Docker — anything)
- Analyzes the content using Claude Sonnet to detect errors, warnings, and anomalies
- Outputs a structured JSON report with severity, root cause, and suggested fixes
You'll also add streaming support so you can watch the analysis unfold in your terminal as Claude processes each section of the log.
Prerequisites
You need an EzAI API key and Python 3.9+. Install the Anthropic SDK:
pip install anthropicSet your environment variables. If you've already run the EzAI install script, these are configured automatically:
export ANTHROPIC_API_KEY="sk-your-ezai-key"
export ANTHROPIC_BASE_URL="https://ezaiapi.com"
The Core Analyzer
Start with a file called log_analyzer.py. The key insight is crafting a system prompt that tells Claude to think like an SRE — focus on patterns, not individual lines:
import anthropic
import json
import sys

client = anthropic.Anthropic(
    base_url="https://ezaiapi.com"
)

SYSTEM_PROMPT = """You are a senior SRE analyzing server logs. For each log input:

1. Identify ALL errors, warnings, and anomalies
2. Group related issues into incidents
3. For each incident, provide:
   - severity: critical | high | medium | low
   - summary: one-line description
   - root_cause: your best assessment
   - affected_lines: line numbers or timestamps
   - fix: specific actionable suggestion

Return valid JSON with this structure:
{
  "incidents": [...],
  "health_score": 0-100,
  "summary": "one paragraph overview"
}

Be specific. Reference actual error codes, IP addresses, and timestamps from the logs.
Do NOT fabricate details that aren't in the logs."""

def analyze_logs(log_content: str, model: str = "claude-sonnet-4-5") -> dict:
    message = client.messages.create(
        model=model,
        max_tokens=4096,
        system=SYSTEM_PROMPT,
        messages=[{
            "role": "user",
            "content": f"Analyze these logs:\n\n{log_content}"
        }]
    )
    return json.loads(message.content[0].text)
That's the skeleton. The SYSTEM_PROMPT does the heavy lifting — it constrains Claude's output to structured JSON and forces it to reference actual log data. Without that constraint, you'd get prose-style summaries that are harder to pipe into alerting systems.
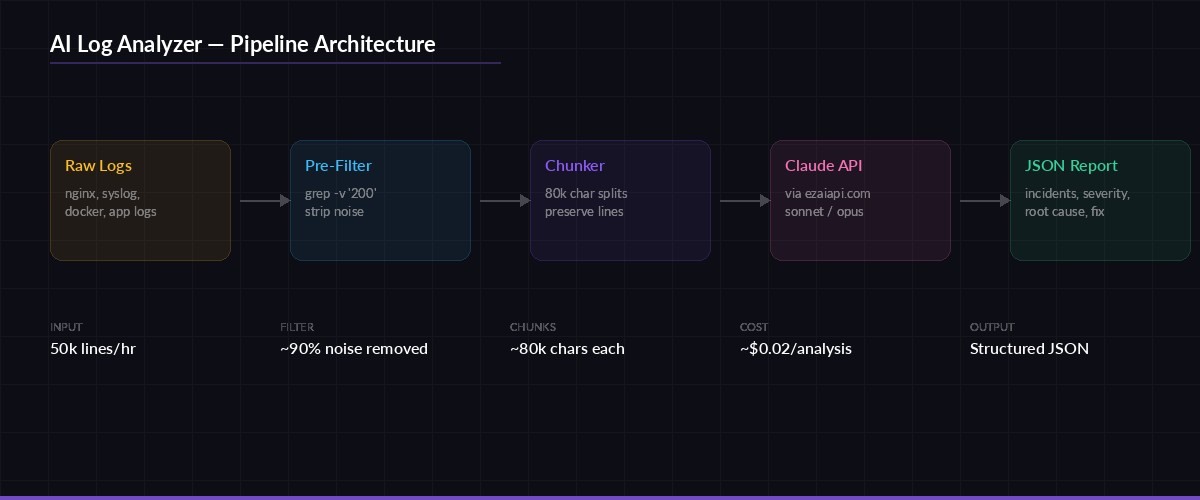
The analysis pipeline: raw logs are chunked, sent to Claude via EzAI, and returned as structured incident reports
Handling Large Log Files
Claude's context window is generous, but a 500MB access log will still blow past it. The solution is chunking — split logs into segments, analyze each one, then merge the results. Here's the chunking logic:
def chunk_logs(content: str, max_chars: int = 80_000) -> list[str]:
    """Split logs into chunks, preserving complete lines."""
    lines = content.splitlines(keepends=True)
    chunks, current = [], []
    current_size = 0

    for line in lines:
        if current_size + len(line) > max_chars and current:
            chunks.append("".join(current))
            current = []
            current_size = 0
        current.append(line)
        current_size += len(line)

    if current:
        chunks.append("".join(current))
    return chunks

def analyze_large_log(filepath: str) -> dict:
    with open(filepath) as f:
        content = f.read()

    chunks = chunk_logs(content)
    all_incidents = []

    for i, chunk in enumerate(chunks):
        print(f"Analyzing chunk {i+1}/{len(chunks)}...")
        result = analyze_logs(chunk)
        all_incidents.extend(result.get("incidents", []))

    return {
        "incidents": all_incidents,
        "total_chunks": len(chunks),
        "total_incidents": len(all_incidents)
    }
The max_chars=80_000 default keeps each chunk well within Sonnet's context limit while leaving room for the system prompt and response. Adjust this based on your log line density — Nginx access logs average 200 characters per line, while Python tracebacks can hit 2,000+.
Adding Real-Time Streaming
For large files, waiting 30 seconds for a response is painful. Streaming lets you watch the analysis as it happens. EzAI supports the same streaming API as Anthropic's direct endpoint:
def analyze_streaming(log_content: str) -> str:
    """Stream the analysis to stdout in real time."""
    full_response = ""

    with client.messages.stream(
        model="claude-sonnet-4-5",
        max_tokens=4096,
        system=SYSTEM_PROMPT,
        messages=[{
            "role": "user",
            "content": f"Analyze these logs:\n\n{log_content}"
        }]
    ) as stream:
        for text in stream.text_stream:
            print(text, end="", flush=True)
            full_response += text

    print()  # newline after stream ends
    return full_response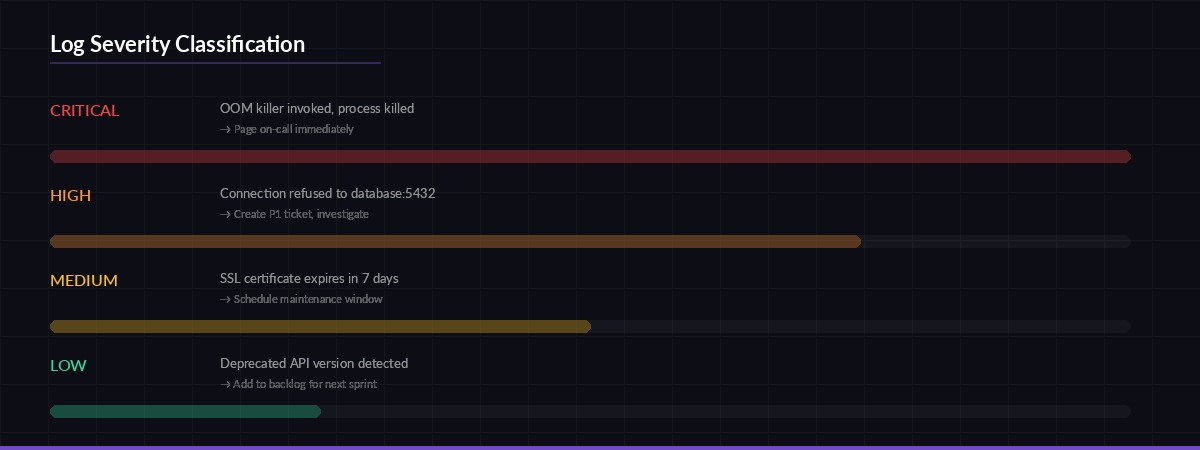
How the analyzer classifies log entries by severity — each level maps to a different response priority
Building the CLI Interface
Wrap everything in a __main__ block that accepts a file path, an optional model flag, and a streaming toggle:
import argparse

if __name__ == "__main__":
    parser = argparse.ArgumentParser(description="AI-powered log analyzer")
    parser.add_argument("logfile", help="Path to log file")
    parser.add_argument("--model", default="claude-sonnet-4-5",
                        help="Model to use (default: claude-sonnet-4-5)")
    parser.add_argument("--stream", action="store_true",
                        help="Stream analysis in real time")
    parser.add_argument("--output", "-o", help="Save JSON report to file")
    args = parser.parse_args()

    with open(args.logfile) as f:
        content = f.read()

    print(f"📋 Analyzing {args.logfile} ({len(content):,} chars)...")

    if args.stream:
        raw = analyze_streaming(content)
        report = json.loads(raw)
    else:
        report = analyze_logs(content, model=args.model)

    # Print summary
    incidents = report.get("incidents", [])
    critical = sum(1 for i in incidents if i["severity"] == "critical")
    print(f"\n🔍 Found {len(incidents)} incidents ({critical} critical)")
    print(f"💚 Health score: {report.get('health_score', 'N/A')}/100")

    if args.output:
        with open(args.output, "w") as f:
            json.dump(report, f, indent=2)
        print(f"📁 Report saved to {args.output}")
Run it against any log file:
# Basic analysis
python log_analyzer.py /var/log/nginx/error.log

# Stream output + save report
python log_analyzer.py /var/log/syslog --stream -o report.json

# Use Opus for complex multi-service logs
python log_analyzer.py app.log --model claude-opus-4
Optimizing Costs
Log analysis can burn tokens fast. A 10,000-line Nginx log is roughly 40,000 tokens of input. Here are three ways to keep costs under control with EzAI:
- Pre-filter with grep. Strip routine 200-status lines before sending to Claude. A simple
grep -v '" 200 'on Nginx access logs can cut input by 90%. - Use Haiku for triage. Run a first pass with
claude-3-5-haiku-latest(cheapest model) to flag suspicious sections, then send only those sections to Sonnet for deep analysis. - Enable response caching. If you're analyzing the same log type repeatedly (say, hourly cron runs on the same server), cache the system prompt to save on input tokens.
With EzAI's pricing, a typical analysis of 5,000 filtered log lines costs roughly $0.02 with Sonnet. Run it hourly and you're looking at under $15/month for continuous log monitoring across multiple servers.
Going Further
This 120-line script is a starting point. From here you can:
- Pipe output into Slack or Discord for real-time incident alerts
- Add a
--watchflag that tails the log file and re-analyzes every N minutes - Build a FastAPI wrapper so your team can upload logs through a web UI
- Store reports in a database to track incident trends over time
The key advantage of routing through EzAI instead of direct API calls: you get access to every model through one endpoint, automatic rate limit handling, and your costs stay visible in a single dashboard. Swap models by changing one string — no SDK changes, no key rotation, no billing surprises.
Grab the full source from the examples above, point it at your noisiest log file, and let Claude do the reading for you.