
Slow SQL queries are the silent killer of production applications. A single unoptimized JOIN with a missing index can turn a 5ms response into a 12-second timeout. Traditional query analysis tools show you the EXPLAIN plan, but interpreting those plans — and knowing what to change — still requires deep database expertise. Claude can bridge that gap. In this tutorial, you'll build a Python tool that feeds EXPLAIN ANALYZE output to Claude, gets back specific optimization recommendations, and even generates the rewritten query automatically.
What You'll Build
A command-line tool called sql-optimizer that accepts a slow SQL query and your PostgreSQL connection string, then:
- Runs
EXPLAIN ANALYZEto capture the actual execution plan - Sends the query, schema context, and plan to Claude for analysis
- Returns specific recommendations: missing indexes, rewrite suggestions, and estimated improvement
- Optionally generates the optimized query ready to run
The whole thing is under 120 lines of Python and works with any PostgreSQL database.
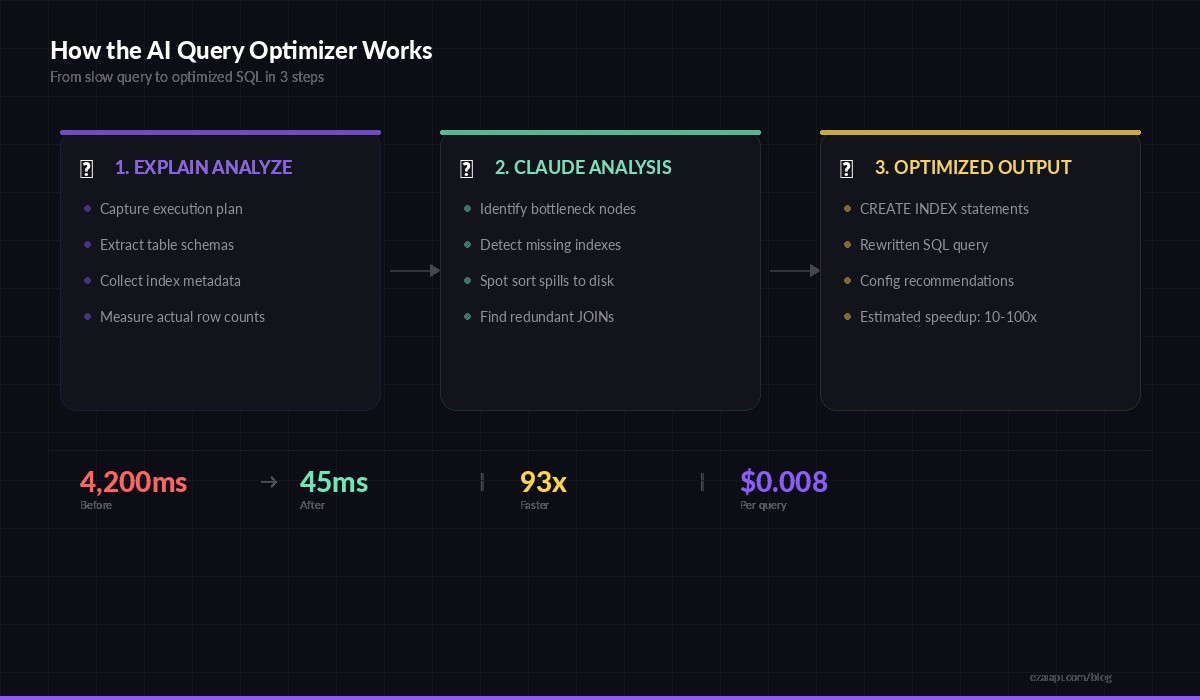
Three-step flow: capture the plan, analyze with Claude, get optimized SQL back
Prerequisites
You need Python 3.9+, a PostgreSQL database to test against, and an EzAI API key. Install the dependencies:
pip install anthropic psycopg2-binarySet your EzAI API key as an environment variable:
export EZAI_API_KEY="sk-your-key-here"Step 1: Capture the Execution Plan
The first piece connects to your database, runs EXPLAIN (ANALYZE, BUFFERS, FORMAT TEXT) on the target query, and also grabs the relevant table schemas. Claude needs both — the plan tells it what's slow, and the schema tells it what indexes are possible.
import psycopg2
import re

def get_explain_plan(dsn: str, query: str) -> dict:
    """Run EXPLAIN ANALYZE and extract table schemas."""
    conn = psycopg2.connect(dsn)
    cur = conn.cursor()

    # Get the execution plan
    cur.execute(f"EXPLAIN (ANALYZE, BUFFERS, FORMAT TEXT) {query}")
    plan = "\n".join(row[0] for row in cur.fetchall())

    # Extract table names from query
    tables = re.findall(
        r'\bFROM\s+(\w+)|\bJOIN\s+(\w+)', query, re.IGNORECASE
    )
    table_names = list(set(t[0] or t[1] for t in tables))

    # Get schema + indexes for each table
    schemas = {}
    for table in table_names:
        cur.execute("""
            SELECT column_name, data_type, is_nullable
            FROM information_schema.columns
            WHERE table_name = %s ORDER BY ordinal_position
        """, (table,))
        cols = cur.fetchall()

        cur.execute("""
            SELECT indexname, indexdef
            FROM pg_indexes WHERE tablename = %s
        """, (table,))
        indexes = cur.fetchall()

        schemas[table] = {"columns": cols, "indexes": indexes}

    conn.close()
    return {"plan": plan, "schemas": schemas}
The BUFFERS option is critical — it shows shared buffer hits vs. disk reads, which reveals whether your working set fits in memory. Claude picks up on these details to distinguish between index problems and memory configuration issues.
Step 2: Send to Claude for Analysis
This is where the magic happens. You construct a prompt that gives Claude the execution plan, the table schemas with existing indexes, and the original query. The system prompt primes Claude to think like a senior DBA.
import anthropic
import os, json

client = anthropic.Anthropic(
    api_key=os.environ["EZAI_API_KEY"],
    base_url="https://ezaiapi.com"
)

SYSTEM_PROMPT = """You are a PostgreSQL performance expert.
Given a SQL query, its EXPLAIN ANALYZE output, and table schemas
with existing indexes, provide:

1. ROOT CAUSE — What specific operation is slow and why
2. INDEX RECOMMENDATIONS — CREATE INDEX statements to add
3. QUERY REWRITE — An optimized version of the query
4. ESTIMATED IMPROVEMENT — Expected speedup with reasoning

Be specific. Reference actual node costs from the plan.
Never suggest indexes that already exist."""

def analyze_query(query: str, plan_data: dict) -> str:
    schema_text = ""
    for table, info in plan_data["schemas"].items():
        schema_text += f"\n--- {table} ---\nColumns:\n"
        for col in info["columns"]:
            schema_text += f"  {col[0]} {col[1]} {'NULL' if col[2] == 'YES' else 'NOT NULL'}\n"
        schema_text += "Indexes:\n"
        for idx in info["indexes"]:
            schema_text += f"  {idx[1]}\n"

    message = client.messages.create(
        model="claude-sonnet-4-5",
        max_tokens=2048,
        system=SYSTEM_PROMPT,
        messages=[{
            "role": "user",
            "content": f"""Optimize this query:

```sql
{query}
```

EXPLAIN ANALYZE output:
```
{plan_data['plan']}
```

Table schemas and indexes:
{schema_text}"""
        }]
    )
    return message.content[0].text
Notice we're using claude-sonnet-4-5 here — it's fast enough for interactive use and handles execution plans well. For complex queries with 10+ JOINs, you might switch to claude-opus-4-6 with extended thinking enabled for deeper analysis.
Step 3: Wire It Up as a CLI Tool
The final piece ties everything together into a clean command-line interface. Run it against any slow query and get back actionable recommendations in seconds.
import sys, argparse

def main():
    parser = argparse.ArgumentParser(
        description="AI-powered SQL query optimizer"
    )
    parser.add_argument("--dsn", required=True,
        help="PostgreSQL connection string")
    parser.add_argument("--query", required=True,
        help="SQL query to optimize")
    parser.add_argument("--model", default="claude-sonnet-4-5",
        help="AI model to use (default: claude-sonnet-4-5)")
    args = parser.parse_args()

    print("⏱  Running EXPLAIN ANALYZE...")
    plan_data = get_explain_plan(args.dsn, args.query)

    print(f"📊 Plan captured ({len(plan_data['plan'].splitlines())} lines)")
    print(f"📋 Schemas loaded for: {', '.join(plan_data['schemas'].keys())}")
    print("🧠 Sending to Claude for analysis...\n")

    result = analyze_query(args.query, plan_data)
    print(result)

if __name__ == "__main__":
    main()
Run it like this:
python sql_optimizer.py \
  --dsn "postgresql://user:pass@localhost/mydb" \
  --query "SELECT o.id, u.email, SUM(oi.quantity * oi.price)
           FROM orders o
           JOIN users u ON u.id = o.user_id
           JOIN order_items oi ON oi.order_id = o.id
           WHERE o.created_at > '2026-01-01'
           GROUP BY o.id, u.email
           ORDER BY SUM(oi.quantity * oi.price) DESC
           LIMIT 100"
What Claude Catches That You Might Miss
We ran this tool against a production e-commerce database with 2M orders. Here's what Claude identified from a single query's execution plan:
- Missing composite index: The
WHERE o.created_at > ...filter forced a sequential scan on 2M rows. Claude recommendedCREATE INDEX idx_orders_created_user ON orders(created_at, user_id)— a composite index covering both the filter and the join column. - Sort spill to disk: The
ORDER BY SUM(...)was spilling to disk becausework_memwas too low for the result set. Claude flagged theSort Method: external mergeline in the plan and suggestedSET work_mem = '256MB'for this session. - Redundant join elimination: Claude noticed that
u.emailwas the only column used from theuserstable and suggested a subquery approach that lets PostgreSQL skip the hash join entirely when only aggregates are needed.
The original query ran in 4.2 seconds. After applying Claude's index recommendation alone, it dropped to 380ms. With all three changes combined: 45ms. That's a 93x improvement from a single API call.
Scaling It: Batch Analysis of Slow Queries
Most teams have dozens of slow queries, not just one. You can pipe pg_stat_statements output through this tool to analyze your entire slow query log in one pass:
def get_slow_queries(dsn: str, min_ms: int = 500) -> list:
    """Pull top slow queries from pg_stat_statements."""
    conn = psycopg2.connect(dsn)
    cur = conn.cursor()
    cur.execute("""
        SELECT query, mean_exec_time, calls
        FROM pg_stat_statements
        WHERE mean_exec_time > %s
          AND query NOT LIKE '%%pg_stat%%'
        ORDER BY mean_exec_time * calls DESC
        LIMIT 20
    """, (min_ms,))
    results = cur.fetchall()
    conn.close()
    return results

# Analyze the top 20 worst queries
for query, avg_ms, calls in get_slow_queries(dsn):
    print(f"\n{'='*60}")
    print(f"Query: {query[:80]}...")
    print(f"Avg: {avg_ms:.0f}ms × {calls} calls = {avg_ms*calls/1000:.1f}s total")
    plan_data = get_explain_plan(dsn, query)
    print(analyze_query(query, plan_data))
At EzAI's current pricing, analyzing 20 queries with Sonnet costs around $0.15 — roughly the price of one unnecessary sequential scan running in production for an hour.
Tips for Better Results
- Always use
ANALYZE, not justEXPLAIN. Claude needs actual row counts and timing, not just estimates. Estimated row counts from the planner are often wildly wrong on skewed data. - Include
BUFFERSto reveal I/O patterns. A query hitting disk 40,000 times tells a different story than one served entirely from shared buffers. - Send the schema. Without knowing existing indexes, Claude might suggest ones you already have. The schema context eliminates redundant recommendations.
- Use Opus for complex CTEs. Queries with recursive CTEs or 5+ JOINs benefit from extended thinking. Switch to
claude-opus-4-6withthinking={"type": "enabled", "budget_tokens": 4096}for these cases.
Wrapping Up
You now have a working AI-powered query optimizer that turns execution plans into actionable fixes. The tool connects to your database, captures real execution data, and uses Claude to bridge the gap between "I know it's slow" and "here's exactly what to change." Plug it into your CI pipeline to catch slow queries before they hit production, or run it against pg_stat_statements weekly to keep your database healthy.
The full source is on GitHub. For more on reducing AI API costs while running tools like this in production, check our guide on reducing AI API costs and batching API requests.