Your PagerDuty goes off at 3 AM. A Datadog alert fires about elevated 5xx rates. You open Slack, scroll through 200 lines of logs, and spend 40 minutes figuring out the database connection pool was exhausted because a new deployment removed a query index. That entire triage could have taken 30 seconds with an AI incident responder that reads your alerts, pulls correlated logs, and tells you what broke and how to fix it.
In this guide, we'll build exactly that — a Python service that ingests alerts from any monitoring tool, feeds them to Claude via EzAI API, and produces structured incident reports with root cause analysis and remediation steps. Total cost: under $10/month for a team handling 50 incidents per week.
Architecture Overview
The system has three components: an alert ingestion webhook that receives alerts from Datadog, PagerDuty, or Grafana; a log correlator that fetches relevant logs around the alert timestamp; and a Claude analysis engine that reads everything and produces a structured incident report.
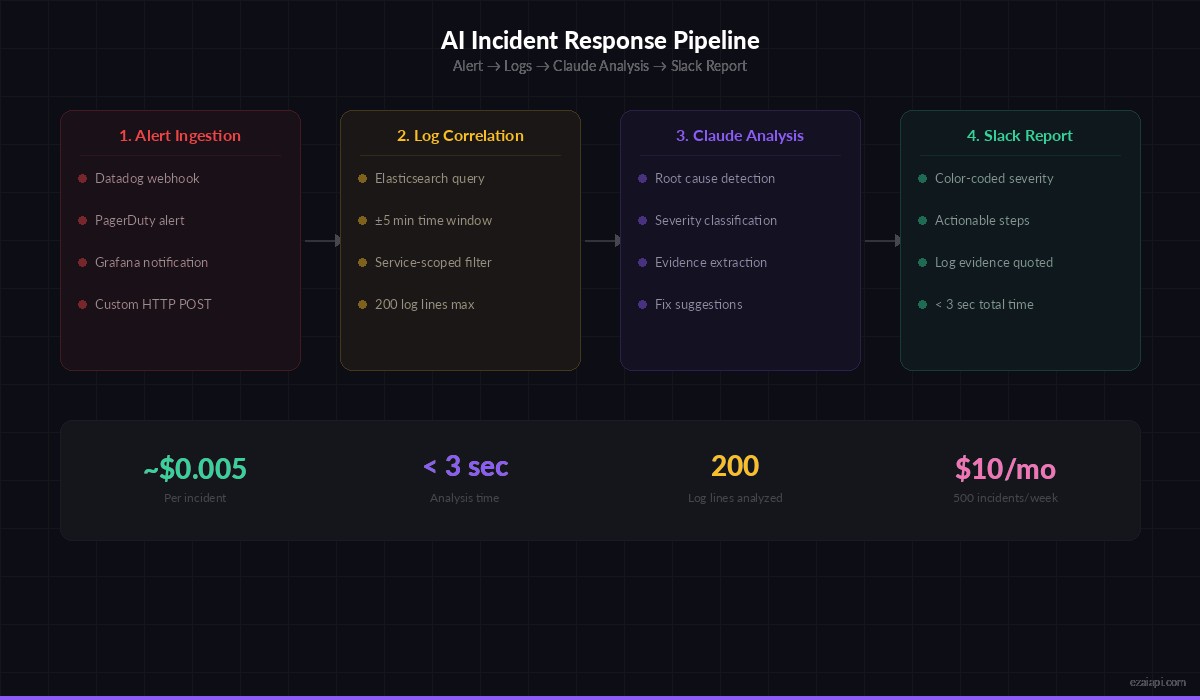
End-to-end incident response pipeline: from alert to actionable Slack report in under 3 seconds
Here's the flow:
- Alert webhook receives a firing alert (HTTP POST)
- Log correlator pulls logs from the affected service ±5 minutes around the trigger time
- Claude analyzes the alert metadata + logs together
- Structured report posts to Slack with severity, root cause, and suggested fix
Setting Up the Webhook Server
We'll use FastAPI for the webhook endpoint. It accepts alerts from any monitoring tool that can send JSON webhooks — Datadog, PagerDuty, Grafana, even a simple cURL from a shell script.
pip install fastapi uvicorn anthropic httpximport anthropic
import httpx
from fastapi import FastAPI, Request
from datetime import datetime, timedelta
from pydantic import BaseModel
app = FastAPI()
client = anthropic.Anthropic(
api_key="sk-your-ezai-key",
base_url="https://ezaiapi.com",
)
class Alert(BaseModel):
service: str
severity: str # critical, warning, info
title: str
description: str
timestamp: str
source: str = "unknown" # datadog, pagerduty, grafana
metadata: dict = {}
@app.post("/webhook/alert")
async def handle_alert(alert: Alert):
# 1. Fetch correlated logs
logs = await fetch_logs(
service=alert.service,
around=alert.timestamp,
window_minutes=5,
)
# 2. Analyze with Claude
report = await analyze_incident(alert, logs)
# 3. Post to Slack
await post_to_slack(report)
return {"status": "analyzed", "severity": report["severity"]}The webhook accepts a standardized alert format. You can write thin adapters for each monitoring tool — Datadog sends different JSON than PagerDuty, but they all map to the same Alert model.
Building the Log Correlator
The log correlator fetches logs from your logging infrastructure around the alert timestamp. This example uses Elasticsearch, but you can swap it for CloudWatch, Loki, or plain log files over SSH.
ELASTICSEARCH_URL = "http://localhost:9200"

async def fetch_logs(service: str, around: str, window_minutes: int = 5) -> str:
    ts = datetime.fromisoformat(around)
    start = ts - timedelta(minutes=window_minutes)
    end = ts + timedelta(minutes=window_minutes)

    query = {
        "query": {
            "bool": {
                "must": [
                    {"match": {"service": service}},
                    {"range": {
                        "@timestamp": {
                            "gte": start.isoformat(),
                            "lte": end.isoformat(),
                        }
                    }}
                ]
            }
        },
        "sort": [{"@timestamp": "asc"}],
        "size": 200,
    }

    async with httpx.AsyncClient() as http:
        resp = await http.post(
            f"{ELASTICSEARCH_URL}/{service}-*/_search",
            json=query,
        )
        hits = resp.json()["hits"]["hits"]

    # Format logs as timestamped lines for Claude
    lines = []
    for hit in hits:
        src = hit["_source"]
        level = src.get("level", "INFO")
        msg = src.get("message", "")
        ts = src.get("@timestamp", "")
        lines.append(f"[{ts}] {level}: {msg}")

    return "\n".join(lines)
The key trick: we fetch logs from before the alert fired, not just after. The root cause almost always precedes the symptom. A 5-minute window on each side catches the chain of events leading up to the failure.
The Claude Analysis Engine
This is where the real value lives. Claude reads the alert metadata and correlated logs, then produces a structured JSON report with severity classification, root cause analysis, and actionable remediation steps.
import json

SYSTEM_PROMPT = """You are an SRE incident responder. Analyze the alert and logs provided.
Return a JSON object with these exact fields:
- severity: P1 (service down), P2 (degraded), P3 (minor), P4 (cosmetic)
- root_cause: One sentence explaining what broke and why
- evidence: 2-3 specific log lines that prove your diagnosis
- remediation: Ordered list of steps to fix the issue right now
- prevention: What to change so this doesn't happen again
- affected_users: estimated blast radius (none, low, medium, high, critical)
Be specific. Reference actual log timestamps and error messages."""

async def analyze_incident(alert: Alert, logs: str) -> dict:
    user_msg = f"""ALERT:
Service: {alert.service}
Severity: {alert.severity}
Title: {alert.title}
Description: {alert.description}
Timestamp: {alert.timestamp}
Source: {alert.source}
Metadata: {json.dumps(alert.metadata, indent=2)}

CORRELATED LOGS ({len(logs.splitlines())} lines):
{logs}"""

    response = client.messages.create(
        model="claude-sonnet-4-5",
        max_tokens=2048,
        system=SYSTEM_PROMPT,
        messages=[{"role": "user", "content": user_msg}],
    )

    # Parse the JSON response
    text = response.content[0].text
    # Strip markdown code fences if present
    if text.startswith("```"):
        text = text.split("\n", 1)[1].rsplit("```", 1)[0]

    report = json.loads(text)
    report["alert_title"] = alert.title
    report["service"] = alert.service
    return report
We use claude-sonnet-4-5 here because it's fast enough for real-time incident response (under 3 seconds) and cheap through EzAI. For complex multi-service incidents, you can upgrade to claude-opus-4 on the same API call — just change the model string. No configuration changes needed since EzAI gives you access to all models through the same endpoint.
Posting Results to Slack
The Slack integration formats Claude's analysis into a readable thread. Color-coded by severity, with expandable sections for evidence and remediation.
SLACK_WEBHOOK = "https://hooks.slack.com/services/YOUR/WEBHOOK/URL"

SEVERITY_COLORS = {
    "P1": "#e11d48",  # red
    "P2": "#f59e0b",  # amber
    "P3": "#3b82f6",  # blue
    "P4": "#6b7280",  # gray
}

async def post_to_slack(report: dict):
    severity = report["severity"]
    color = SEVERITY_COLORS.get(severity, "#6b7280")

    remediation = "\n".join(
        f"{i+1}. {step}"
        for i, step in enumerate(report["remediation"])
    )

    evidence = "\n".join(
        f"• `{line}`" for line in report["evidence"]
    )

    payload = {
        "attachments": [{
            "color": color,
            "blocks": [
                {"type": "header", "text": {
                    "type": "plain_text",
                    "text": f"🚨 {severity} — {report['alert_title']}"
                }},
                {"type": "section", "text": {
                    "type": "mrkdwn",
                    "text": f"*Root Cause:* {report['root_cause']}\n"
                             f"*Blast Radius:* {report['affected_users']}\n\n"
                             f"*Evidence:*\n{evidence}\n\n"
                             f"*Fix Now:*\n{remediation}\n\n"
                             f"*Prevent Recurrence:* {report['prevention']}"
                }},
            ]
        }]
    }

    async with httpx.AsyncClient() as http:
        await http.post(SLACK_WEBHOOK, json=payload)
Testing with a Real Alert
Start the server and fire a test alert:
# Terminal 1: start the server
uvicorn incident_responder:app --port 8000

# Terminal 2: send a test alert
curl -X POST http://localhost:8000/webhook/alert \
  -H "Content-Type: application/json" \
  -d '{
    "service": "api-gateway",
    "severity": "critical",
    "title": "5xx rate exceeded 15% for api-gateway",
    "description": "HTTP 500 errors spiked from 0.2% to 18.3% at 03:14 UTC",
    "timestamp": "2026-03-09T03:14:00Z",
    "source": "datadog",
    "metadata": {"region": "us-east-1", "deploy_sha": "a1b2c3d"}
  }'
Claude's analysis comes back in under 3 seconds. The Slack message tells you exactly what happened, which log lines prove it, and what commands to run to fix it right now — while you're still rubbing sleep out of your eyes.
Cost Breakdown
Each incident analysis uses roughly 1,500 input tokens (alert + ~200 log lines) and 500 output tokens (the JSON report). With claude-sonnet-4-5 through EzAI:
- Per incident: ~$0.005 (half a cent)
- 50 incidents/week: ~$1.00/month
- 200 incidents/week: ~$4.00/month
- Even at 500 incidents/week: under $10/month
Compare that to the engineering hours saved. A single P1 incident triage that takes 30 minutes instead of 3 minutes costs your team 27 minutes of downtime at 3 AM. Multiply that by the number of on-call rotations per month and the math is obvious.
Check the full pricing on the EzAI pricing page.
Production Hardening
Before deploying this to production, add these three things:
Rate limiting per service. If a service flaps (alerts fire and resolve repeatedly), you don't want to analyze the same issue 50 times. Deduplicate alerts by service + title within a 10-minute window.
Fallback when logs are unavailable. Sometimes Elasticsearch is the thing that's broken. If log fetching fails, still send the alert to Claude — it can make useful suggestions from the alert metadata alone, and it should flag that logs were unavailable.
Incident memory. Store past analyses in a SQLite database. Before analyzing a new alert, query for recent incidents on the same service. Include them in Claude's context with a note like "This service had a P2 incident 3 hours ago with root cause: connection pool exhaustion." Claude will correlate recurring issues and catch patterns humans miss at 3 AM.
For a full production deployment guide, check the EzAI documentation on handling rate limits and streaming responses.
What's Next
You now have an AI incident responder that turns raw alerts into actionable triage reports. From here, you can extend it to:
- Auto-execute safe remediation steps (restart pods, scale up replicas)
- Generate post-mortems by chaining multiple incident reports
- Build a searchable knowledge base of past incidents for faster future triage
- Add tool use so Claude can query your infrastructure directly
The complete source code is about 200 lines of Python. No ML infrastructure, no fine-tuning, no GPU. Just an API call that turns chaos into clarity.