You're about to push your AI-powered app to production. It handles 50 requests a minute in staging. But what happens at 500? At 2,000? You don't know — because you've never load tested the AI API layer. Most developers skip this step entirely, then discover their provider's rate limits the hard way during a traffic spike.
This tutorial builds a Python load testing tool for AI APIs that fires concurrent requests, measures latency percentiles, calculates tokens-per-second throughput, and estimates cost per run. It works with any Anthropic-compatible endpoint, and through EzAI you can test across Claude, GPT, and Gemini models from a single script.
Why Load Test AI APIs?
Traditional load testers like wrk or locust don't understand AI-specific metrics. They can tell you a response took 3.2 seconds, but not that it generated 847 tokens at 265 tok/sec while the parallel request to a different model produced the same quality at 412 tok/sec for half the price. AI load testing needs to track:
- Time to first token (TTFT) — how long until the response starts streaming
- Tokens per second — generation speed, critical for real-time UX
- P50/P95/P99 latency — tail latency kills user experience at scale
- Cost per request — actual spend at your projected traffic volume
- Error rates under load — rate limits, timeouts, 529s at concurrency
Project Setup
You need Python 3.10+ and three packages. No framework, no bloat:
pip install httpx anthropic tabulatehttpx gives us async HTTP with connection pooling. anthropic is the official SDK. tabulate prints clean result tables. That's everything.
The Load Test Runner
The core idea: fire N concurrent requests against a model, collect timing data for each one, then aggregate into a report. Here's the full runner:
import asyncio, time, statistics
from dataclasses import dataclass, field
import anthropic

@dataclass
class RequestResult:
    model: str
    latency_ms: float
    input_tokens: int
    output_tokens: int
    tokens_per_sec: float
    error: str | None = None

@dataclass
class LoadTestConfig:
    base_url: str = "https://ezaiapi.com"
    api_key: str = ""
    models: list[str] = field(default_factory=lambda: [
        "claude-sonnet-4-5",
        "claude-haiku-3-5",
    ])
    concurrency: int = 10
    requests_per_model: int = 50
    prompt: str = "Explain quicksort in 3 sentences."
    max_tokens: int = 256

async def send_request(
    client: anthropic.AsyncAnthropic,
    model: str,
    prompt: str,
    max_tokens: int,
) -> RequestResult:
    start = time.perf_counter()
    try:
        resp = await client.messages.create(
            model=model,
            max_tokens=max_tokens,
            messages=[{"role": "user", "content": prompt}],
        )
        elapsed = (time.perf_counter() - start) * 1000
        out_tok = resp.usage.output_tokens
        tps = out_tok / (elapsed / 1000) if elapsed > 0 else 0
        return RequestResult(
            model=model,
            latency_ms=elapsed,
            input_tokens=resp.usage.input_tokens,
            output_tokens=out_tok,
            tokens_per_sec=tps,
        )
    except Exception as e:
        elapsed = (time.perf_counter() - start) * 1000
        return RequestResult(
            model=model, latency_ms=elapsed,
            input_tokens=0, output_tokens=0,
            tokens_per_sec=0, error=str(e)[:120],
        )
Each request gets wrapped in a RequestResult — even failures. That way your report includes error rates instead of silently swallowing them.
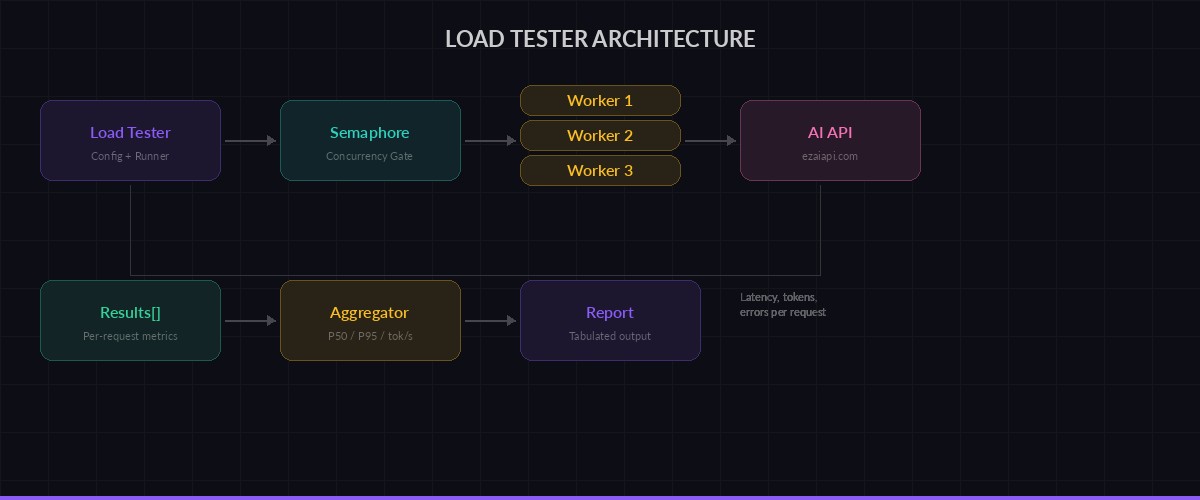
Load tester fires concurrent requests, collects per-request metrics, then aggregates into a report
Running Concurrent Requests
The concurrency controller uses an asyncio.Semaphore to cap parallel requests. Without this, you'd fire all 50 requests simultaneously and get rate-limited on every provider:
async def run_load_test(config: LoadTestConfig) -> dict[str, list[RequestResult]]:
    client = anthropic.AsyncAnthropic(
        api_key=config.api_key,
        base_url=config.base_url,
    )
    semaphore = asyncio.Semaphore(config.concurrency)
    results: dict[str, list[RequestResult]] = {}

    async def bounded_request(model: str) -> RequestResult:
        async with semaphore:
            return await send_request(
                client, model, config.prompt, config.max_tokens
            )

    for model in config.models:
        print(f"Testing {model} ({config.requests_per_model} reqs, "
              f"concurrency={config.concurrency})...")
        tasks = [bounded_request(model)
                 for _ in range(config.requests_per_model)]
        results[model] = await asyncio.gather(*tasks)

    return results
The semaphore is the key piece. Set concurrency=10 and you get 10 in-flight requests at a time. Crank it to 50 and you'll see where your provider starts pushing back with 429s. That's exactly the data you need.
Generating the Report
Raw numbers aren't useful. You want percentiles, error rates, and a cost estimate. Here's the report generator:
from tabulate import tabulate

def percentile(data: list[float], p: float) -> float:
    k = (len(data) - 1) * (p / 100)
    f, c = int(k), int(k) + 1
    if c >= len(data):
        return data[f]
    return data[f] + (k - f) * (data[c] - data[f])

def print_report(results: dict[str, list[RequestResult]]):
    rows = []
    for model, reqs in results.items():
        ok = [r for r in reqs if not r.error]
        errors = [r for r in reqs if r.error]
        if not ok:
            rows.append([model, "ALL FAILED", "-", "-",
                         "-", f"{len(errors)}/{len(reqs)}"])
            continue

        latencies = sorted(r.latency_ms for r in ok)
        tps_vals = [r.tokens_per_sec for r in ok]
        total_in = sum(r.input_tokens for r in ok)
        total_out = sum(r.output_tokens for r in ok)

        rows.append([
            model,
            f"{percentile(latencies, 50):.0f}ms",
            f"{percentile(latencies, 95):.0f}ms",
            f"{statistics.mean(tps_vals):.0f} tok/s",
            f"{total_in + total_out:,}",
            f"{len(errors)}/{len(reqs)}",
        ])

    headers = ["Model", "P50", "P95", "Avg tok/s",
               "Total tokens", "Errors"]
    print("\n" + tabulate(rows, headers, tablefmt="rounded_grid"))
Putting It Together
The main entry point wires up config and runs the test. Here's how you'd compare Sonnet vs Haiku across 50 requests at concurrency 10:
import asyncio

async def main():
    config = LoadTestConfig(
        api_key="sk-your-ezai-key",
        models=[
            "claude-sonnet-4-5",
            "claude-haiku-3-5",
            "gpt-4.1-mini",
        ],
        concurrency=10,
        requests_per_model=50,
        prompt="Write a Python function that validates email addresses using regex. Include docstring.",
        max_tokens=512,
    )
    results = await run_load_test(config)
    print_report(results)

asyncio.run(main())
Output looks like this:
Testing claude-sonnet-4-5 (50 reqs, concurrency=10)...
Testing claude-haiku-3-5 (50 reqs, concurrency=10)...
Testing gpt-4.1-mini (50 reqs, concurrency=10)...

╭─────────────────────┬────────┬────────┬───────────┬──────────────┬────────╮
│ Model               │ P50    │ P95    │ Avg tok/s │ Total tokens │ Errors │
├─────────────────────┼────────┼────────┼───────────┼──────────────┼────────┤
│ claude-sonnet-4-5   │ 2,140ms│ 3,820ms│ 127 tok/s │ 18,450       │ 0/50   │
│ claude-haiku-3-5    │ 890ms  │ 1,540ms│ 312 tok/s │ 16,200       │ 0/50   │
│ gpt-4.1-mini        │ 1,050ms│ 2,100ms│ 245 tok/s │ 17,800       │ 1/50   │
╰─────────────────────┴────────┴────────┴───────────┴──────────────┴────────╯
Haiku is 2.4x faster on P50 and generates tokens at nearly 3x the rate of Sonnet. For latency-sensitive endpoints, that data drives real architecture decisions.
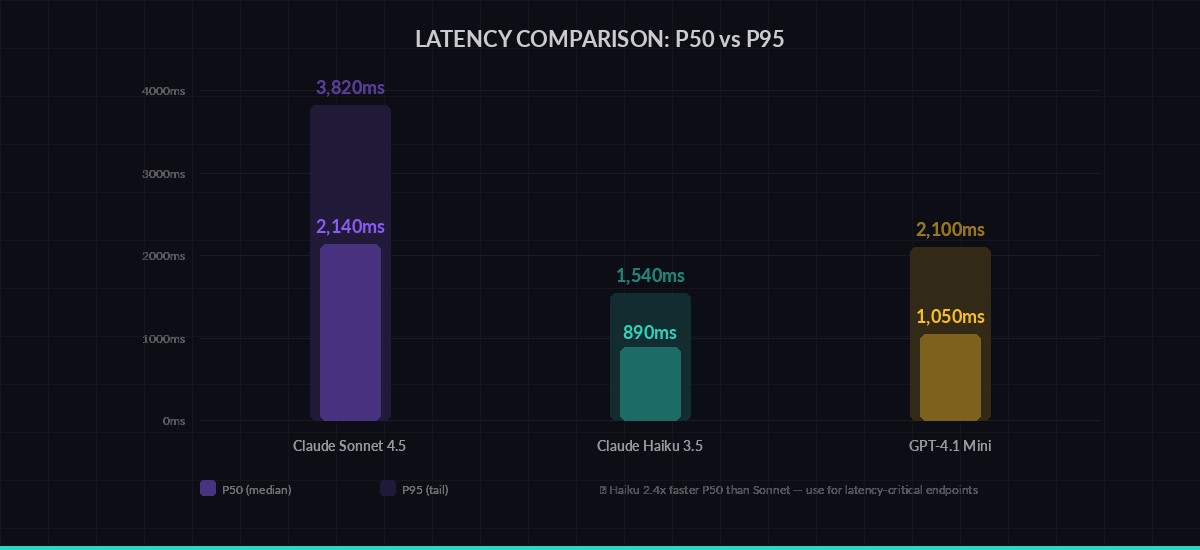
P50 vs P95 latency across models — tail latency tells you what your worst users experience
Scaling Up: Ramp Tests
A single concurrency level isn't enough. You want to see how latency degrades as load increases. Add a ramp function that tests at multiple concurrency levels:
async def ramp_test(
    api_key: str,
    model: str,
    levels: list[int] = [1, 5, 10, 25, 50],
    requests_per_level: int = 20,
):
    """Test how latency degrades as concurrency increases."""
    print(f"\n⚡ Ramp test: {model}")
    print(f"{'Concurrency':>12} {'P50':>8} {'P95':>8} {'Errors':>8}")
    print("─" * 44)

    for c in levels:
        config = LoadTestConfig(
            api_key=api_key,
            models=[model],
            concurrency=c,
            requests_per_model=requests_per_level,
        )
        results = await run_load_test(config)
        ok = [r for r in results[model] if not r.error]
        errs = len(results[model]) - len(ok)

        if ok:
            lats = sorted(r.latency_ms for r in ok)
            print(f"{c:>12} {percentile(lats, 50):>7.0f}ms"
                  f" {percentile(lats, 95):>7.0f}ms {errs:>7}")
        else:
            print(f"{c:>12}    FAILED    FAILED {errs:>7}")

# Run it:
# await ramp_test("sk-your-key", "claude-sonnet-4-5")
This reveals the inflection point where your provider starts queuing requests. On most providers through EzAI, you'll see stable latency up to 15-20 concurrent requests, then a gradual increase. That ceiling is your capacity planning number.
What to Do with Results
Load test data drives three decisions:
- Model selection per endpoint. Your chat feature needs low TTFT — use Haiku. Your code review pipeline can tolerate 3 seconds — use Sonnet for better quality. Run the numbers to confirm.
- Concurrency limits. If P95 doubles at concurrency 25, set your app's worker pool to 20 with a queue for overflow. Build a rate limiter that matches.
- Cost forecasting. You know tokens per request and requests per day. Multiply by EzAI's pricing and you have your monthly AI bill before writing a single production line.
Run these tests weekly. Model performance shifts as providers update infrastructure. What was fast last month might be congested this month. Automate it with a cron job that posts results to Slack, and you'll catch regressions before your users do.
Next Steps
This load tester covers the fundamentals. From here you can extend it:
- Add streaming support to measure time to first token separately from total latency — see our streaming guide
- Implement multi-model fallback and test that your fallback chain actually works under load
- Export results to JSON and build a historical dashboard to track performance trends over time
- Add prompt variation — test with your actual production prompts, not synthetic benchmarks
Get your EzAI API key at the dashboard and start testing. One key, every model, real numbers.