
"The model is slow today" is not a useful incident report. Neither is "users are complaining." If you operate an AI-powered product — chat, summarization, code completion, anything — you need a measurable definition of working, and a way to know when you're spending reliability faster than you can earn it. That's what SLOs and error budgets are for.
This guide walks through SLO design specifically for AI APIs, where token-based latency, hallucination rates, and provider failovers complicate the classic SRE playbook. Every example below works against ezaiapi.com so you can copy, paste, and run.
Defining SLOs for AI APIs
An SLO (Service Level Objective) is a target — usually a percentage — measured over a rolling window. The math: SLO = good_events / valid_events ≥ target. The trick with LLMs is choosing what counts as a "good event." A 200 response with garbage text is technically up but practically broken.
For an AI API I recommend running three SLIs (Service Level Indicators) in parallel:
- Availability SLI — fraction of requests not returning 5xx, timeouts, or upstream provider errors.
- Latency SLI — fraction of requests where time-to-first-token is under your threshold (e.g., 1.5s for chat UX, 5s for batch).
- Quality SLI — fraction of responses that pass automated guardrails: schema validation, refusal detection, profanity filters, length bounds.
Pick targets per tier, not per service. Auth flows get 99.95%; the auto-generated weekly digest gets 99%. The table below is a sane starting point.
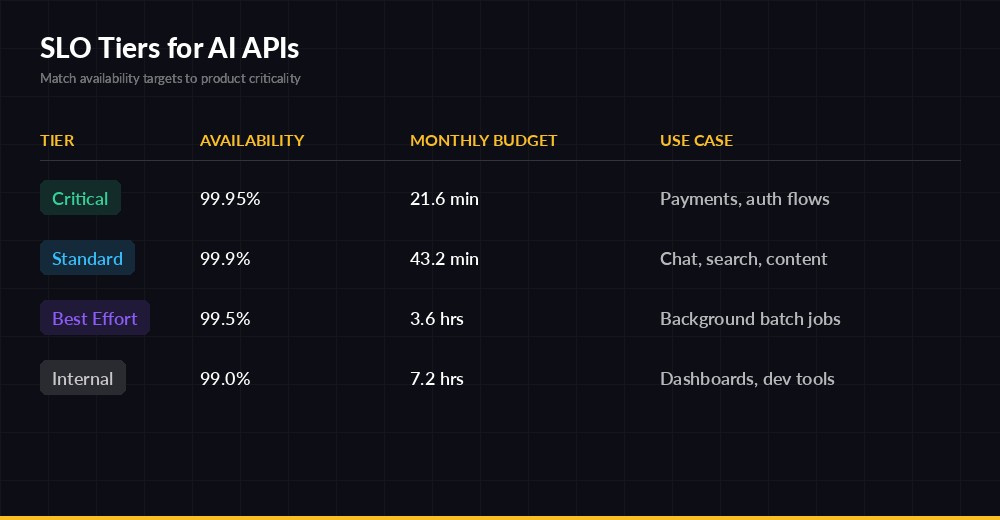
SLO tiers — match availability targets to the criticality of each surface
Computing the Three SLIs
You don't need a fancy observability platform to start. A handful of counters in Redis or Prometheus will do. Here's the minimum viable instrumentation around an AI call:
import time, anthropic, redis

r = redis.Redis()
client = anthropic.Anthropic(
    api_key="sk-your-key",
    base_url="https://ezaiapi.com",
)

LATENCY_THRESHOLD_MS = 1500

def call_with_sli(prompt, tier="standard"):
    bucket = time.strftime("%Y%m%d%H%M")  # minute granularity
    r.incr(f"sli:{tier}:total:{bucket}")
    t0 = time.monotonic()
    try:
        stream = client.messages.stream(
            model="claude-sonnet-4-5",
            max_tokens=1024,
            messages=[{"role": "user", "content": prompt}],
        )
        with stream as s:
            for _ in s.text_stream:
                ttft_ms = (time.monotonic() - t0) * 1000
                break
            text = s.get_final_message().content[0].text
        r.incr(f"sli:{tier}:availability_good:{bucket}")
        if ttft_ms < LATENCY_THRESHOLD_MS:
            r.incr(f"sli:{tier}:latency_good:{bucket}")
        if passes_guardrails(text):
            r.incr(f"sli:{tier}:quality_good:{bucket}")
        return text
    except Exception as e:
        # Availability miss; latency/quality untouched (don't double-penalize)
        raise
Three things to notice. First, we measure time-to-first-token, not total duration — for streaming UIs that's the number users feel. Second, we don't credit latency or quality on a failed request; only count what's well-defined. Third, we bucket by minute so we can compute rolling windows cheaply with a Lua script or a sliding sum.
Don't Forget the "Valid Events" Denominator
Exclude requests you don't control: 401s from bad client keys, 4xx validation errors, deliberate request cancellations. Those aren't your service failing — including them turns a customer's misconfiguration into your alert page.
Tracking Error Budget Burn
The error budget is the inverse of your SLO. A 99.9% target on a 30-day window allows 0.1% × 30 days = 43.2 minutes of unavailability. Once that budget is spent, you stop shipping risky changes. That rule is the entire point — error budgets translate reliability into a currency engineers and PMs can negotiate over.
Burn rate is the multiplier of "normal" budget consumption. Burn rate = 1 means you'll exactly exhaust your budget by month-end. Burn rate = 14.4 means you'll burn the entire monthly budget in two hours. Google's SRE Workbook recommends multi-window, multi-burn-rate alerts so you catch both fast outages and slow leaks.
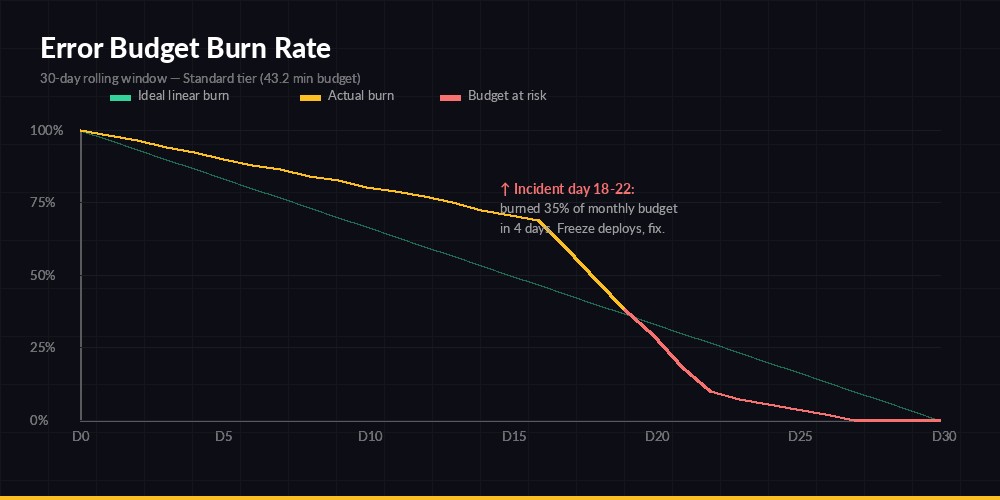
A 5-day incident burned 35% of a monthly budget — freeze deploys until SLI recovers
Computing Burn Rate from Counters
def burn_rate(tier, window_minutes, slo=0.999):
    now = time.time()
    total = good = 0
    for i in range(window_minutes):
        ts = time.strftime("%Y%m%d%H%M", time.gmtime(now - i*60))
        total += int(r.get(f"sli:{tier}:total:{ts}") or 0)
        good  += int(r.get(f"sli:{tier}:availability_good:{ts}") or 0)
    if total == 0:
        return 0.0
    error_rate = 1 - good/total
    allowed    = 1 - slo
    return error_rate / allowed  # >1 means burning faster than budget

# Recommended alert pairs (page on both, ticket on either alone):
# - 5min window AND 1h window, burn_rate >= 14.4   → page (2% in 1h)
# - 30min window AND 6h window, burn_rate >= 6      → page (5% in 6h)
# - 2h window AND 24h window, burn_rate >= 3        → ticket (10% in 24h)
# - 6h window AND 3d window, burn_rate >= 1         → ticket (slow leak)
The pair-window trick prevents flappy alerts: a single 5-minute spike in the short window won't page unless the longer window also confirms sustained burn. It's the difference between waking the on-call for one bad node versus a real degradation.
What to Do When You Burn the Budget
The policy matters more than the alert. Without a written rule, every team negotiates from scratch every incident. A workable default:
- 50% budget remaining — normal operation; ship features freely.
- 25% remaining — code freeze for risky changes; require a second reviewer on infra PRs.
- 0% / overspent — full deploy freeze except reliability fixes. Engineering work shifts to known reliability debt until budget regenerates.
Pair this with multi-model fallback and circuit breakers so a single provider hiccup doesn't drain the whole budget.
SLOs Specific to LLM Behavior
Classic web SLOs ignore output content. AI SLOs can't. Three you should add:
- Refusal rate — fraction of valid requests where the model refused or returned a safety response. Spikes here usually mean a prompt template regressed.
- Schema-validity rate — for tool-calling and structured JSON, the % of responses that parse cleanly. Closely related to structured JSON output reliability.
- Cost-per-success — total spend divided by good events. Rising COGS-per-success often catches model drift before users do.
import json, re

def passes_guardrails(text: str) -> bool:
    if len(text) < 8:                          # suspicious empties
        return False
    if re.search(r"\b(I cannot|I'm unable|as an AI)\b", text):
        return False                          # refusal pattern
    if text.strip().startswith("{"):           # expected JSON
        try:
            json.loads(text)
        except json.JSONDecodeError:
            return False
    return True
Adapt the patterns to your product, but always keep the guardrail list short and audited. A noisy quality SLI is worse than no SLI — it desensitizes the on-call rotation and you'll miss the real incident when it lands.
Putting It Together
Start with one tier and one SLI. Pick availability, set 99.9%, instrument it, and watch the dashboard for two weeks before you tune. Add latency next, then quality. Resist the urge to define ten SLOs on day one — you'll just create alert fatigue.
If you're running on EzAI, the dashboard already exposes per-request latency and status, so you can scaffold the availability SLI from existing data while you stand up Redis counters for the rest. From there it's iteration: every postmortem should either justify the current SLO, tighten it, or loosen it. Numbers that never change aren't SLOs — they're decoration.
Where to Go Next
- Reduce burn proactively with latency reduction tactics.
- Wire up production monitoring and alerting for the burn-rate alerts above.
- Browse the full EzAI API docs to see headers and status codes you can drive SLIs from.