Your AI feature works great in staging. You ship it. Three days later, your CEO asks why the AI support bot started recommending competitors, latency doubled, and the bill tripled overnight. You have no idea because you never set up monitoring.
Running AI models in production without observability is like driving at night with the headlights off. Everything feels fine until it isn't. This guide walks through building a practical monitoring and alerting stack for AI-powered applications using EzAI API, covering the four things that actually matter: model drift, latency, cost, and errors.
The Four Pillars of AI Observability
Traditional APM tools track HTTP status codes and response times. That's necessary but nowhere near sufficient for AI workloads. A 200 OK response that contains a hallucinated answer is worse than a 500 error — at least the 500 gets caught by your existing alerting.
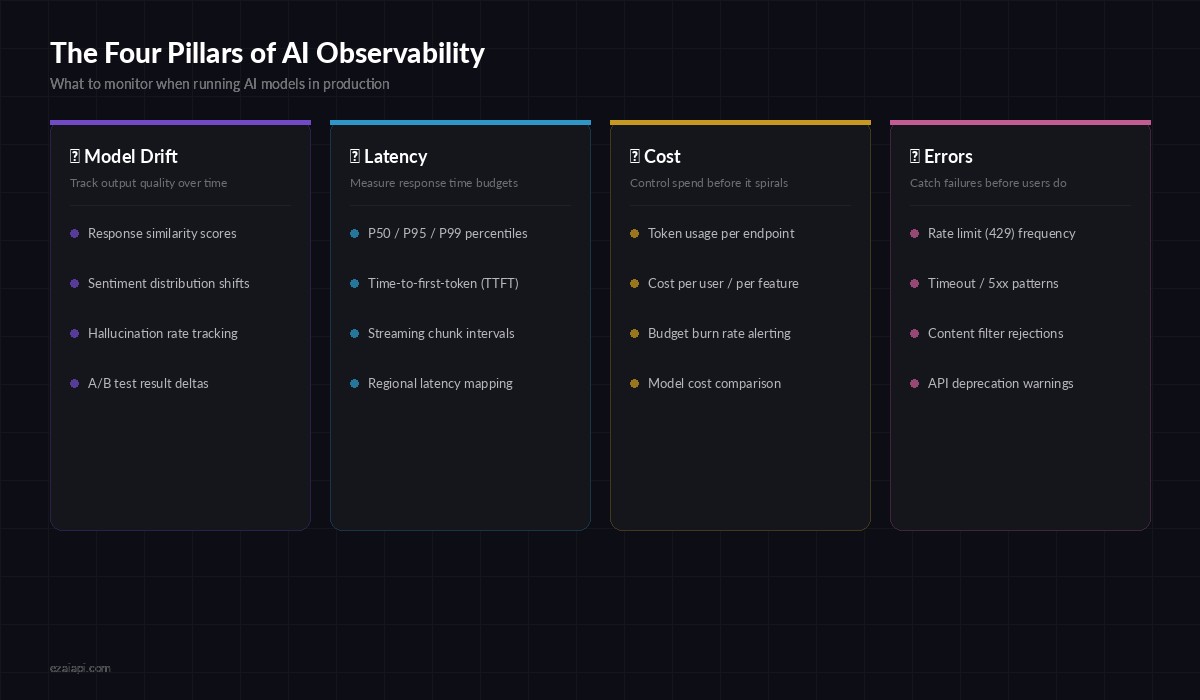
Four dimensions to monitor when running AI models in production
Here's what you need to track beyond standard HTTP metrics:
- Model drift — output quality degrades over time as models update or your data distribution shifts
- Latency budgets — P95 latency matters more than average, and time-to-first-token determines perceived speed
- Cost tracking — token usage per feature, per user, per model, with burn-rate projections
- Error classification — rate limits, timeouts, content filters, and deprecation warnings each need different responses
Building the Metrics Collector
The foundation is a middleware layer that wraps every AI API call and extracts structured metrics. Here's a Python implementation that works with EzAI's Anthropic-compatible endpoint:
import time, json, httpx
from dataclasses import dataclass, field
from collections import defaultdict

@dataclass
class AIMetric:
    model: str
    endpoint: str
    latency_ms: float
    input_tokens: int
    output_tokens: int
    status_code: int
    cost_usd: float
    timestamp: float = field(default_factory=time.time)
    error_type: str | None = None

class MetricsCollector:
    def __init__(self):
        self.metrics: list[AIMetric] = []
        self.hourly_cost = defaultdict(float)

    async def tracked_request(self, client, model, messages):
        start = time.monotonic()
        try:
            resp = await client.post(
                "https://api.ezaiapi.com/v1/messages",
                headers={"x-api-key": API_KEY},
                json={"model": model, "messages": messages,
                      "max_tokens": 1024}
            )
            elapsed = (time.monotonic() - start) * 1000
            data = resp.json()
            usage = data.get("usage", {})

            metric = AIMetric(
                model=model, endpoint="/v1/messages",
                latency_ms=elapsed,
                input_tokens=usage.get("input_tokens", 0),
                output_tokens=usage.get("output_tokens", 0),
                status_code=resp.status_code,
                cost_usd=self.calc_cost(model, usage),
            )
            self.metrics.append(metric)
            self.update_hourly(metric)
            return data
        except httpx.HTTPStatusError as e:
            self.metrics.append(AIMetric(
                model=model, endpoint="/v1/messages",
                latency_ms=(time.monotonic()-start)*1000,
                input_tokens=0, output_tokens=0,
                status_code=e.response.status_code,
                cost_usd=0, error_type=self.classify_error(e),
            ))
            raise
Every request now produces a structured AIMetric record with latency, token counts, cost, and error classification. The hourly_cost accumulator gives you a rolling burn rate you can alert on.
Latency Tracking with Percentile Buckets
Average latency is misleading for AI workloads. A model that returns in 500ms 90% of the time but takes 15 seconds for the rest will wreck your user experience. Track percentiles instead:
import numpy as np
from datetime import datetime, timedelta

class LatencyTracker:
    def __init__(self, window_minutes=5):
        self.window = timedelta(minutes=window_minutes)
        self.samples: list[tuple[float, float]] = []  # (timestamp, latency_ms)

    def record(self, latency_ms: float):
        now = time.time()
        self.samples.append((now, latency_ms))
        self._prune()

    def percentiles(self) -> dict:
        self._prune()
        if not self.samples:
            return {}
        values = [s[1] for s in self.samples]
        return {
            "p50": np.percentile(values, 50),
            "p95": np.percentile(values, 95),
            "p99": np.percentile(values, 99),
            "count": len(values),
        }

    def check_alert(self, threshold_ms=5000) -> bool:
        p = self.percentiles()
        return p.get("p95", 0) > threshold_ms

# Usage with EzAI metrics
tracker = LatencyTracker(window_minutes=5)
# After each tracked_request call:
tracker.record(metric.latency_ms)
if tracker.check_alert(threshold_ms=5000):
    send_alert("P95 latency exceeded 5s", tracker.percentiles())
Wire this into your metrics collector so every response automatically feeds the tracker. Set separate thresholds per model — Claude Opus at 8 seconds is normal, Claude Haiku at 8 seconds means something is wrong.
Cost Alerting That Actually Prevents Surprises
The worst production AI incident isn't a crash — it's a $2,000 bill you didn't expect. Build cost guardrails with burn-rate alerting:
class CostGuard:
    # Token pricing per model (per 1M tokens)
    PRICING = {
        "claude-sonnet-4-20250514": {"input": 3.0, "output": 15.0},
        "claude-opus-4-20250514": {"input": 15.0, "output": 75.0},
        "gpt-4o": {"input": 2.5, "output": 10.0},
    }

    def __init__(self, hourly_limit=25.0, daily_limit=200.0):
        self.hourly_limit = hourly_limit
        self.daily_limit = daily_limit
        self.hourly_spend = 0.0
        self.daily_spend = 0.0
        self.last_reset_hour = time.time()
        self.last_reset_day = time.time()

    def record_usage(self, model, input_tokens, output_tokens):
        prices = self.PRICING.get(model, {"input": 5.0, "output": 15.0})
        cost = (input_tokens * prices["input"] +
                output_tokens * prices["output"]) / 1_000_000
        self.hourly_spend += cost
        self.daily_spend += cost
        self._check_limits()
        return cost

    def _check_limits(self):
        if self.hourly_spend > self.hourly_limit * 0.8:
            send_alert("⚠️ AI spend at 80% of hourly limit",
                       {"current": self.hourly_spend, "limit": self.hourly_limit})
        if self.hourly_spend > self.hourly_limit:
            send_alert("🚨 Hourly AI spend limit BREACHED",
                       {"current": self.hourly_spend, "limit": self.hourly_limit})
            raise RuntimeError("Cost limit exceeded — requests blocked")
The 80% warning gives your team time to investigate before the hard cutoff kicks in. For production systems, combine this with EzAI's built-in usage dashboard which shows real-time spend per model.
Building Your Alert Pipeline
Raw metrics are useless if nobody sees them. You need a pipeline that goes from metric → evaluation → notification with minimal latency:
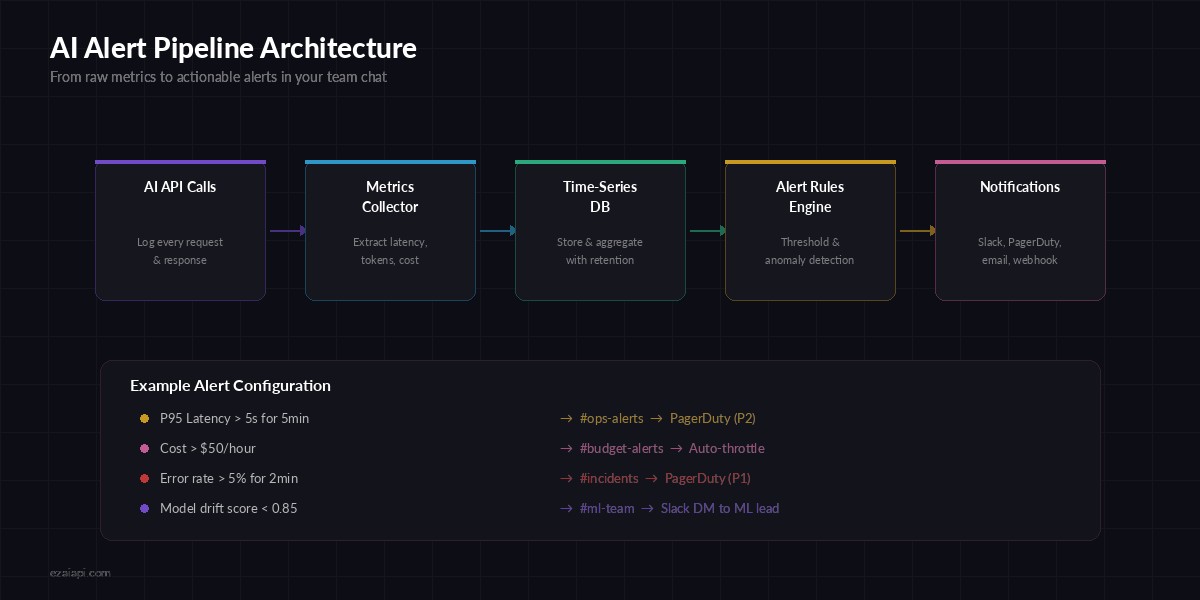
From raw API calls to actionable alerts in your team's Slack channel
Here's a lightweight alerting engine that evaluates rules against your collected metrics and fires notifications:
import asyncio, httpx

class AlertRule:
    def __init__(self, name, check_fn, cooldown_sec=300):
        self.name = name
        self.check_fn = check_fn
        self.cooldown = cooldown_sec
        self.last_fired = 0

    def evaluate(self, metrics) -> str | None:
        result = self.check_fn(metrics)
        if result and time.time() - self.last_fired > self.cooldown:
            self.last_fired = time.time()
            return result
        return None

# Define your alert rules
rules = [
    AlertRule("high_latency", lambda m:
        f"P95 latency: {m['p95']:.0f}ms"
        if m.get("p95", 0) > 5000 else None),
    AlertRule("error_spike", lambda m:
        f"Error rate: {m['error_rate']:.1%}"
        if m.get("error_rate", 0) > 0.05 else None),
    AlertRule("cost_spike", lambda m:
        f"Hourly cost: ${m['hourly_cost']:.2f}"
        if m.get("hourly_cost", 0) > 50 else None),
]

async def send_alert(message, context):
    async with httpx.AsyncClient() as client:
        await client.post(SLACK_WEBHOOK, json={
            "text": f"🚨 *AI Alert*: {message}\n```{json.dumps(context, indent=2)}```"
        })
Each rule includes a cooldown to prevent alert fatigue. A 5-minute cooldown means you get one notification per issue, not a wall of identical alerts. Pair this with proper error handling so alerts lead to automatic remediation where possible.
Model Drift Detection
This is the hardest pillar to get right. Unlike latency or cost, model drift is subtle — the API still returns 200, the response still looks reasonable, but quality has silently degraded. One practical approach is to run a small set of golden test cases on a schedule and compare outputs:
from difflib import SequenceMatcher

GOLDEN_TESTS = [
    {
        "prompt": "Classify this support ticket: 'My payment failed'",
        "expected_contains": ["billing", "payment"],
        "baseline_output": "Category: Billing/Payment Issue..."
    },
    # Add 10-20 representative test cases
]

async def run_drift_check(client, model):
    scores = []
    for test in GOLDEN_TESTS:
        resp = await client.post(
            "https://api.ezaiapi.com/v1/messages",
            headers={"x-api-key": API_KEY},
            json={"model": model, "max_tokens": 256,
                  "messages": [{"role": "user", "content": test["prompt"]}]}
        )
        output = resp.json()["content"][0]["text"]

        # Check keyword presence
        keywords_found = sum(1 for kw in test["expected_contains"]
                             if kw.lower() in output.lower())
        keyword_score = keywords_found / len(test["expected_contains"])

        # Check similarity to baseline
        similarity = SequenceMatcher(
            None, test["baseline_output"].lower(), output.lower()
        ).ratio()

        scores.append((keyword_score + similarity) / 2)

    avg_score = sum(scores) / len(scores)
    if avg_score < 0.85:
        await send_alert(f"Model drift detected: score {avg_score:.2f}",
                         {"model": model, "scores": scores})
    return avg_score
Run this hourly via a cron job. When the average score drops below 0.85, it means the model's behavior has shifted enough to warrant investigation. You can extend this with structured output validation for tighter checks on JSON responses.
Putting It All Together
The production-ready setup ties all four pillars into a single monitoring loop. Here's the recommended architecture:
- Wrap all AI calls with the
MetricsCollectorto capture every request - Feed metrics into
LatencyTrackerandCostGuardfor real-time evaluation - Run the alert engine on a 30-second evaluation cycle
- Schedule drift checks hourly against your golden test suite
- Ship metrics to your dashboard — EzAI's built-in dashboard covers cost and usage, supplement with Grafana for custom latency panels
Start with cost and error alerting — those catch the most impactful issues with the least effort. Add latency tracking when you have SLAs to meet. Build drift detection once your AI features are mature enough to have stable baselines.
The teams that ship AI successfully aren't the ones with the fanciest models. They're the ones who know within 60 seconds when something goes sideways. Build your monitoring stack before you need it, not after the incident.
Ready to build production AI with full observability? Get your EzAI API key — real-time usage tracking, cost monitoring, and multi-model support are built in from day one.