Your AI-powered app is in production. Users complain about slow responses. You check the logs and see a 200 OK that took 14 seconds. Was it the model? The network? Your preprocessing pipeline? Without distributed tracing, you're guessing. OpenTelemetry fixes that by giving you a complete breakdown of every millisecond spent inside your AI API calls — from request validation to token streaming.
This guide walks you through instrumenting AI API calls with OpenTelemetry in Python and Node.js using EzAI API as the backend. You'll capture latency per phase, token counts, model metadata, and error context — all exportable to Jaeger, Grafana Tempo, or any OTLP-compatible backend.
Why Trace AI API Calls?
Standard logging tells you what happened. Tracing tells you where time was spent. For AI calls, this matters more than most HTTP requests because a single messages.create() can take anywhere from 800ms to 60 seconds depending on the model, token count, and whether you're streaming.
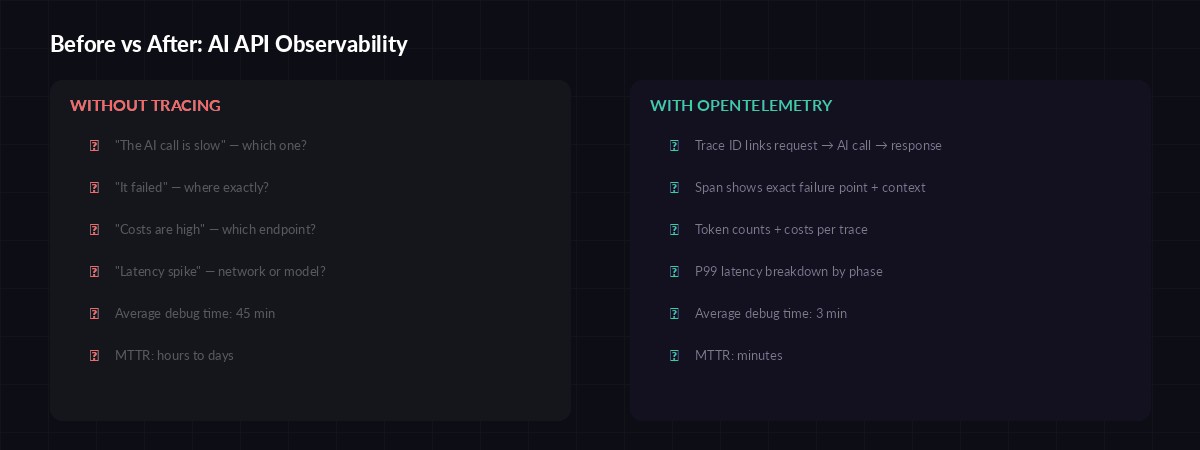
Observability gap: debugging without traces vs. with full OpenTelemetry instrumentation
With proper tracing you can answer questions that logs alone can't:
- Which phase is slow? — Is it DNS, TLS, time-to-first-byte, or token generation?
- How many tokens per dollar? — Attach token counts and cost to each trace span
- Which model is fastest for this prompt type? — Compare P50/P99 across Claude, GPT, Gemini
- Where did the error happen? — Trace ID links the 500 to the exact span that failed
Setting Up OpenTelemetry with EzAI
Python Setup
Install the OpenTelemetry SDK and the HTTP instrumentation package. We'll also add the OTLP exporter to ship traces to your backend:
pip install opentelemetry-api opentelemetry-sdk \
    opentelemetry-exporter-otlp-proto-grpc \
    opentelemetry-instrumentation-httpx \
    anthropic
Now create a tracer provider and wrap your AI calls with custom spans. The key insight: create a parent span for the full request lifecycle, then child spans for each phase:
import anthropic
import time
from opentelemetry import trace
from opentelemetry.sdk.trace import TracerProvider
from opentelemetry.sdk.trace.export import BatchSpanProcessor
from opentelemetry.exporter.otlp.proto.grpc.trace_exporter import OTLPSpanExporter

# Initialize tracer
provider = TracerProvider()
provider.add_span_processor(
    BatchSpanProcessor(OTLPSpanExporter(
        endpoint="http://localhost:4317"
    ))
)
trace.set_tracer_provider(provider)
tracer = trace.get_tracer("ai-service")

client = anthropic.Anthropic(
    api_key="sk-your-key",
    base_url="https://ezaiapi.com"
)

def traced_ai_call(messages, model="claude-sonnet-4-5"):
    with tracer.start_as_current_span("ai.chat") as span:
        span.set_attribute("ai.model", model)
        span.set_attribute("ai.provider", "ezai")
        span.set_attribute("ai.message_count", len(messages))

        t0 = time.perf_counter()

        with tracer.start_as_current_span("ai.request"):
            response = client.messages.create(
                model=model,
                max_tokens=2048,
                messages=messages
            )

        latency_ms = (time.perf_counter() - t0) * 1000

        # Record token usage and cost
        span.set_attribute("ai.tokens.input", response.usage.input_tokens)
        span.set_attribute("ai.tokens.output", response.usage.output_tokens)
        span.set_attribute("ai.latency_ms", round(latency_ms, 2))
        span.set_attribute("ai.stop_reason", response.stop_reason)

        return response
Tracing Streaming Responses
Non-streaming calls are straightforward — one span, one response. Streaming is trickier because the latency splits into two distinct phases: time-to-first-token (TTFT) and token generation. You want separate spans for each:
def traced_stream(messages, model="claude-sonnet-4-5"):
    with tracer.start_as_current_span("ai.stream") as root:
        root.set_attribute("ai.model", model)
        root.set_attribute("ai.streaming", True)

        t0 = time.perf_counter()
        first_token = None
        token_count = 0
        chunks = []

        with client.messages.stream(
            model=model,
            max_tokens=2048,
            messages=messages
        ) as stream:
            for event in stream:
                if hasattr(event, 'type') and event.type == 'content_block_delta':
                    if first_token is None:
                        first_token = time.perf_counter()
                        ttft = (first_token - t0) * 1000
                        root.set_attribute("ai.ttft_ms", round(ttft, 2))
                    token_count += 1
                    chunks.append(event.delta.text)

        total_ms = (time.perf_counter() - t0) * 1000
        root.set_attribute("ai.latency_ms", round(total_ms, 2))
        root.set_attribute("ai.chunks", token_count)

        return "".join(chunks)
The ai.ttft_ms attribute is gold for debugging perceived slowness. A 200ms TTFT with 5-second total is fine — the user sees text flowing immediately. A 4-second TTFT with 5-second total feels broken even though total latency is similar.
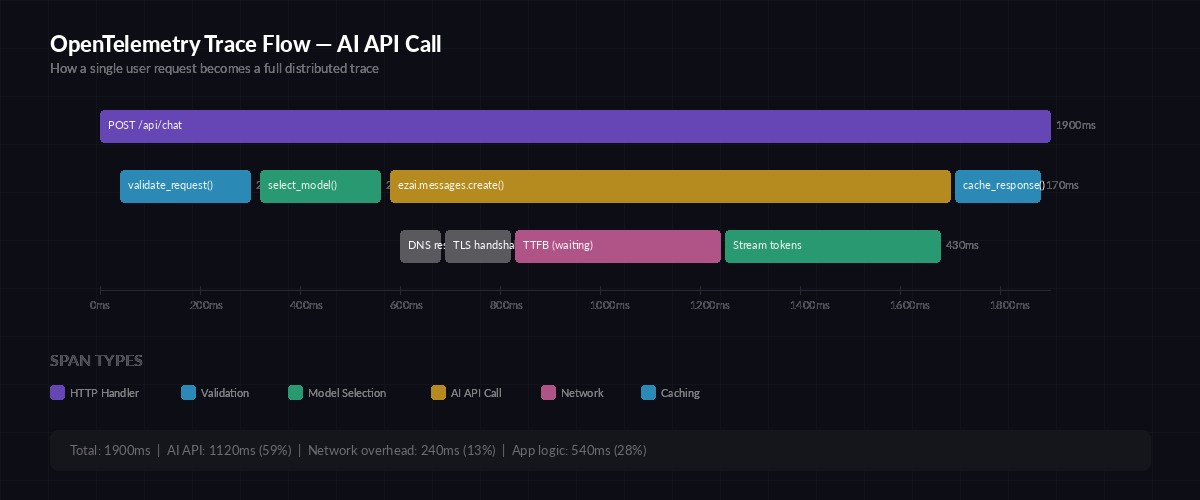
Anatomy of a traced AI API call — each phase gets its own span with timing data
Node.js Implementation
The same pattern works in Node.js with the OpenTelemetry JS SDK. Here's a complete setup using EzAI with the Anthropic SDK:
const { NodeTracerProvider } = require('@opentelemetry/sdk-trace-node');
const { OTLPTraceExporter } = require('@opentelemetry/exporter-trace-otlp-grpc');
const { BatchSpanProcessor } = require('@opentelemetry/sdk-trace-base');
const { trace } = require('@opentelemetry/api');
const Anthropic = require('@anthropic-ai/sdk');

const provider = new NodeTracerProvider();
provider.addSpanProcessor(
  new BatchSpanProcessor(
    new OTLPTraceExporter({ url: 'http://localhost:4317' })
  )
);
provider.register();

const tracer = trace.getTracer('ai-service');
const client = new Anthropic({
  apiKey: 'sk-your-key',
  baseURL: 'https://ezaiapi.com'
});

async function tracedAiCall(messages, model = 'claude-sonnet-4-5') {
  return tracer.startActiveSpan('ai.chat', async (span) => {
    span.setAttribute('ai.model', model);
    const t0 = performance.now();

    const response = await client.messages.create({
      model,
      max_tokens: 2048,
      messages
    });

    span.setAttribute('ai.tokens.input', response.usage.input_tokens);
    span.setAttribute('ai.tokens.output', response.usage.output_tokens);
    span.setAttribute('ai.latency_ms', Math.round(performance.now() - t0));
    span.end();

    return response;
  });
}
Custom Attributes Worth Tracking
The default HTTP instrumentation gives you status codes and durations. For AI calls, you want domain-specific attributes that make traces actually useful in postmortems:
ai.model— The model ID (claude-sonnet-4-5,gpt-4o, etc.)ai.tokens.input/ai.tokens.output— Raw token countsai.cost_usd— Calculated cost based on your provider's pricingai.ttft_ms— Time to first token (streaming only)ai.stop_reason— Why the model stopped (end_turn,max_tokens,tool_use)ai.cache_hit— Whether prompt caching was usedai.retry_count— Number of retries before success (pairs with your retry strategy)
Error Tracing and Alerting
When an AI call fails, you want the trace to capture why — not just that it returned a 429 or 500. Record the error type, the model's error message, and whether it was retried:
from opentelemetry.trace import StatusCode

def traced_ai_call_safe(messages, model="claude-sonnet-4-5"):
    with tracer.start_as_current_span("ai.chat") as span:
        span.set_attribute("ai.model", model)
        try:
            response = client.messages.create(
                model=model,
                max_tokens=2048,
                messages=messages
            )
            span.set_attribute("ai.tokens.input", response.usage.input_tokens)
            span.set_attribute("ai.tokens.output", response.usage.output_tokens)
            return response

        except anthropic.RateLimitError as e:
            span.set_status(StatusCode.ERROR, "Rate limited")
            span.set_attribute("ai.error.type", "rate_limit")
            span.set_attribute("ai.error.retry_after",
                e.response.headers.get("retry-after", "unknown"))
            span.record_exception(e)
            raise

        except anthropic.APIError as e:
            span.set_status(StatusCode.ERROR, str(e))
            span.set_attribute("ai.error.type", type(e).__name__)
            span.set_attribute("ai.error.status", e.status_code)
            span.record_exception(e)
            raise
With this pattern, your Grafana dashboard can alert on ai.error.type = rate_limit spikes or when P99 latency crosses a threshold — before your users file tickets.
Exporting to Jaeger, Grafana Tempo, or Datadog
The examples above export to localhost:4317 via gRPC, which works with any OTLP-compatible collector. For production, you'd typically run an OpenTelemetry Collector that fans out to your backend of choice:
- Jaeger — Self-hosted, great for development. Run
docker run -p 16686:16686 -p 4317:4317 jaegertracing/all-in-one - Grafana Tempo — Pairs with Grafana dashboards. Add the OTLP receiver to your Tempo config
- Datadog / New Relic — Use their OTLP ingest endpoints. No code changes, just update the exporter URL
The trace data is identical regardless of backend. Switch from Jaeger to Tempo by changing one environment variable — your instrumentation code stays the same.
What You'll See in Production
After deploying traced AI calls, your observability stack reveals patterns you couldn't see before:
- Model comparison dashboards — Claude Sonnet averages 1.2s TTFT vs. GPT-4o at 0.8s for the same prompt
- Cost attribution — The /summarize endpoint burns 60% of your token budget because users paste entire documents
- Retry visibility — 3% of requests need one retry, 0.1% need two, and that one request that retried 5 times took 45 seconds total
- Cache effectiveness — Prompt caching via EzAI cuts P50 latency by 40% on repeated system prompts
The traces also serve as an audit trail. When a customer asks "why did the AI say X?" you can pull up the exact trace ID, see the input tokens, model version, and full response metadata. That's compliance-grade observability with zero extra work.
OpenTelemetry tracing turns your AI API from a black box into a glass box. You see every millisecond, every token, every retry. Combined with EzAI's built-in usage dashboard, you get both real-time monitoring and deep-dive debugging from a single integration. Start with the basic traced_ai_call wrapper, then add streaming traces and error attributes as your needs grow.
Check out our guides on production monitoring and debugging AI API calls for more observability patterns that pair well with distributed tracing.