
AI API costs sneak up on you. You start with a prototype spending $2/day, ship to production, and suddenly you're burning $400/month across four models. The EzAI dashboard gives you real-time stats, but sometimes you need a custom monitoring layer — one that logs every request, tracks per-model spending over time, and fires alerts when costs spike. This guide builds exactly that with Python, SQLite, and the EzAI API.
Why Build a Custom Cost Monitor?
The built-in EzAI dashboard covers most use cases. But production teams often need more granular control:
- Per-feature cost attribution — how much does your "summarize document" endpoint cost vs. "code review"?
- Anomaly detection — catch a runaway loop that burned $50 in 10 minutes
- Historical trends — track cost per user/request over weeks and months
- Custom alerts — Slack/email when daily spend exceeds a threshold
We'll build a lightweight middleware that wraps your AI calls, logs metrics to SQLite, and exposes a FastAPI endpoint for querying costs.
Project Setup
Install the dependencies. We're using anthropic for the AI client, fastapi for the dashboard API, and aiosqlite for async database writes that won't block your requests.
pip install anthropic fastapi uvicorn aiosqliteThe Cost-Tracking Wrapper
The core idea: wrap the Anthropic client so every call automatically logs model, tokens, latency, and estimated cost to a local SQLite database. No changes to your existing code — just swap the client.
# cost_tracker.py
import time, sqlite3, json
from datetime import datetime
import anthropic

# EzAI pricing per 1M tokens (input/output)
PRICING = {
    "claude-opus-4":      (15.0, 75.0),
    "claude-sonnet-4-5":  (3.0,  15.0),
    "claude-haiku-4":     (0.8,  4.0),
    "gpt-5.2":            (5.0,  15.0),
    "gemini-3.1-pro":     (1.25, 5.0),
}

def estimate_cost(model, input_tokens, output_tokens):
    rates = PRICING.get(model, (3.0, 15.0))
    return (input_tokens * rates[0] + output_tokens * rates[1]) / 1_000_000

class TrackedClient:
    def __init__(self, db_path="ai_costs.db", **kwargs):
        self.client = anthropic.Anthropic(
            base_url="https://ezaiapi.com",
            **kwargs
        )
        self.db = sqlite3.connect(db_path)
        self.db.execute("""
            CREATE TABLE IF NOT EXISTS requests (
                id INTEGER PRIMARY KEY,
                timestamp TEXT,
                model TEXT,
                feature TEXT,
                input_tokens INTEGER,
                output_tokens INTEGER,
                latency_ms REAL,
                cost_usd REAL
            )
        """)

    def create(self, model, messages, feature="default", **kwargs):
        start = time.perf_counter()
        response = self.client.messages.create(
            model=model, messages=messages, **kwargs
        )
        latency = (time.perf_counter() - start) * 1000

        inp = response.usage.input_tokens
        out = response.usage.output_tokens
        cost = estimate_cost(model, inp, out)

        self.db.execute(
            "INSERT INTO requests VALUES (NULL,?,?,?,?,?,?,?)",
            (datetime.utcnow().isoformat(), model, feature,
             inp, out, round(latency, 1), round(cost, 6))
        )
        self.db.commit()
        return response
The feature parameter is what makes this useful. Tag each call site — "summarize", "code_review", "translate" — and you get per-feature cost breakdowns for free.
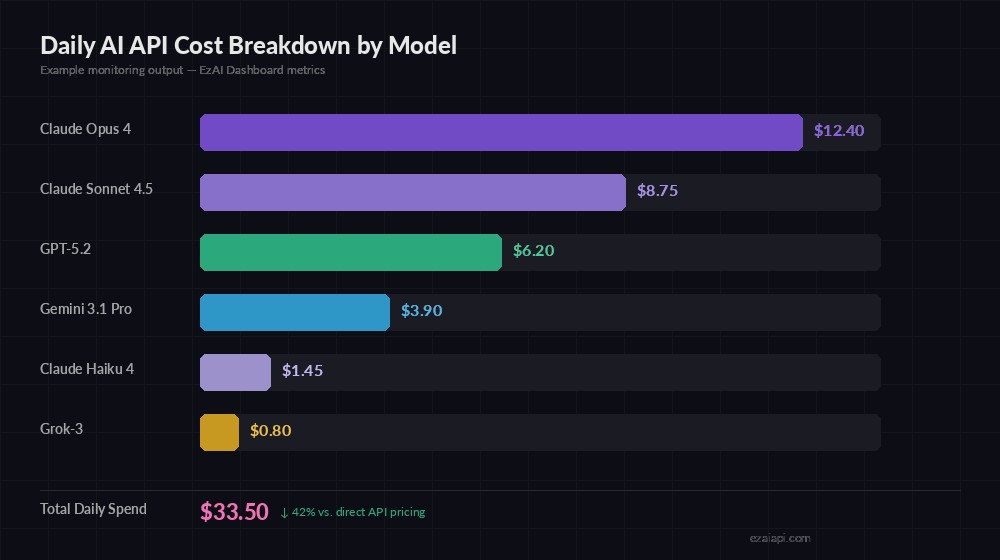
Example output — daily spend broken down by model, showing 42% savings via EzAI
Query Your Costs
With every request logged, you can slice the data any way you need. Here are the queries that matter most in production:
def daily_cost_by_model(db, date="2026-03-12"):
    """Get total spend per model for a given day."""
    rows = db.execute("""
        SELECT model,
               COUNT(*) as calls,
               SUM(input_tokens) as total_in,
               SUM(output_tokens) as total_out,
               SUM(cost_usd) as total_cost
        FROM requests
        WHERE timestamp LIKE ? || '%'
        GROUP BY model
        ORDER BY total_cost DESC
    """, (date,)).fetchall()
    for model, calls, inp, out, cost in rows:
        print(f"{model:25s} {calls:5d} calls  ${cost:.2f}")

def cost_by_feature(db, days=7):
    """Break down costs by feature tag over the last N days."""
    rows = db.execute("""
        SELECT feature,
               COUNT(*) as calls,
               SUM(cost_usd) as total_cost,
               AVG(latency_ms) as avg_latency
        FROM requests
        WHERE timestamp >= datetime('now', ?)
        GROUP BY feature
        ORDER BY total_cost DESC
    """, (f"-{days} days",)).fetchall()
    for feat, calls, cost, lat in rows:
        print(f"{feat:20s} {calls:5d} calls  ${cost:.2f}  avg {lat:.0f}ms")
Latency Tracking and Alerts
Cost is half the picture. Latency spikes can kill user experience. Track P50, P95, and P99 percentiles per model to spot degradation before users complain.
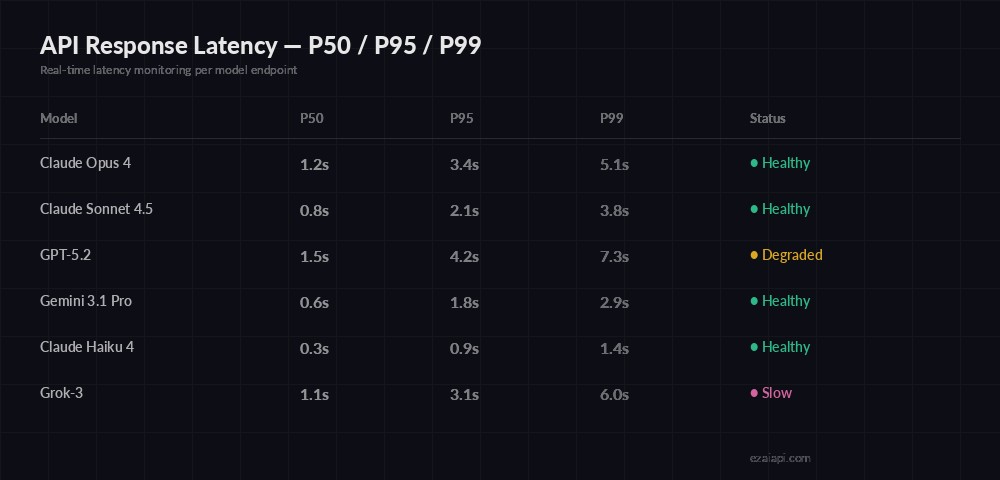
Latency percentiles — catch degraded endpoints before they impact users
import numpy as np

def latency_percentiles(db, model, hours=24):
    """Get P50/P95/P99 latency for a model."""
    rows = db.execute("""
        SELECT latency_ms FROM requests
        WHERE model = ? AND timestamp >= datetime('now', ?)
    """, (model, f"-{hours} hours")).fetchall()
    if not rows:
        return None
    lats = np.array([r[0] for r in rows])
    return {
        "p50": round(np.percentile(lats, 50)),
        "p95": round(np.percentile(lats, 95)),
        "p99": round(np.percentile(lats, 99)),
        "count": len(lats)
    }

def check_cost_alert(db, daily_limit=50.0):
    """Alert if today's spend exceeds limit."""
    row = db.execute("""
        SELECT SUM(cost_usd) FROM requests
        WHERE timestamp >= date('now')
    """).fetchone()
    spent = row[0] or 0
    if spent > daily_limit:
        send_slack_alert(f"⚠️ Daily AI spend: ${spent:.2f} exceeds ${daily_limit} limit")
    return spent
Expose as a FastAPI Dashboard
Wrap the queries in a FastAPI app so your team can check costs from any browser. This takes 30 lines and runs alongside your main service.
# dashboard.py
from fastapi import FastAPI, Query
import sqlite3

app = FastAPI(title="AI Cost Dashboard")
db = sqlite3.connect("ai_costs.db", check_same_thread=False)

@app.get("/costs/today")
def today_costs():
    rows = db.execute("""
        SELECT model, COUNT(*), SUM(cost_usd), AVG(latency_ms)
        FROM requests WHERE timestamp >= date('now')
        GROUP BY model ORDER BY SUM(cost_usd) DESC
    """).fetchall()
    total = sum(r[2] for r in rows)
    return {
        "date": "today",
        "total_usd": round(total, 2),
        "models": [{
            "model": r[0], "calls": r[1],
            "cost": round(r[2], 4),
            "avg_latency_ms": round(r[3], 1)
        } for r in rows]
    }

@app.get("/costs/feature")
def feature_costs(days: int = Query(default=7)):
    rows = db.execute("""
        SELECT feature, COUNT(*), SUM(cost_usd)
        FROM requests WHERE timestamp >= datetime('now', ?)
        GROUP BY feature ORDER BY SUM(cost_usd) DESC
    """, (f"-{days} days",)).fetchall()
    return [{"feature": r[0], "calls": r[1], "cost": round(r[2], 4)} for r in rows]

# Run: uvicorn dashboard:app --port 8090
Hit GET /costs/today and you get a JSON breakdown of every model's spend, call count, and average latency. Plug this into Grafana, Datadog, or a simple React frontend — the data layer is done.
Production Tips
A few things we learned running this pattern across production workloads:
- Use async writes — swap
sqlite3foraiosqlitein async codebases. A synchronous DB write adds 0.5-2ms overhead; async makes it invisible. - Rotate old data — keep a cron that archives rows older than 90 days. SQLite stays fast under 10GB, but there's no reason to keep 6 months of raw request logs.
- Tag aggressively — the
featurefield is your best friend. Tag by endpoint, user tier, or customer ID. The more granular, the more useful your cost attribution becomes. - Set alerts early — don't wait until you get a surprise bill. Set daily and hourly limits from day one. A cost reduction strategy paired with monitoring catches problems before they compound.
- Combine with multi-model fallback — route cheaper queries to Haiku, expensive ones to Opus, and track the savings in your dashboard.
Full Working Example
Here's a complete script that creates the tracker, makes a test call through EzAI, and prints the cost summary:
from cost_tracker import TrackedClient

# Initialize with your EzAI key
ai = TrackedClient(api_key="sk-your-ezai-key")

# Make calls — costs are logged automatically
result = ai.create(
    model="claude-sonnet-4-5",
    messages=[{"role": "user", "content": "Summarize this doc..."}],
    max_tokens=1024,
    feature="summarize"
)

# Check what you've spent
daily_cost_by_model(ai.db)
# claude-sonnet-4-5       1 calls  $0.00
# (real costs appear as usage grows)
That's the full loop: make an AI call, track its cost, query the metrics. The database grows with every request, giving you a complete audit trail of where your AI budget goes. Pair it with the EzAI pricing tiers and you'll know exactly how much you're saving compared to direct API access.