Your team ships a Claude-powered feature on Monday. By Wednesday, a user reports garbled output on a specific edge case. The engineer asks: "What prompt did we actually send? What model version responded? How many tokens did it burn?" Without an audit trail, you're guessing. With one, you pull up the exact request, replay it against the current model, and pinpoint the regression in under a minute.
An AI audit trail captures every API call your application makes — the full request payload, response metadata, token counts, latency, and cost — into a structured, queryable log. It's the difference between "works on my machine" debugging and production-grade observability for AI workloads.
Why You Need an AI Audit Trail
AI APIs are non-deterministic by design. The same prompt can produce different outputs across runs, and model behavior shifts with provider updates. Teams running AI in production hit these problems repeatedly:
- Debugging regressions — A prompt that worked last week now produces garbage. Without the original request/response pair logged, you can't diff what changed.
- Cost forensics — Your AI spend doubled overnight. Which endpoint? Which user? Which prompt is leaking tokens? An audit trail gives you per-request cost attribution.
- Compliance requirements — SOC 2, HIPAA, and GDPR auditors want to know what data you sent to third-party AI providers. An immutable log answers that question.
- Replay and testing — Capture real production requests and replay them against new model versions before rolling out changes.
Architecture: Middleware-Based Logging
The cleanest pattern is a thin middleware layer that sits between your application code and the AI API. Every request passes through, gets enriched with metadata, and the full round-trip gets logged after the response arrives.
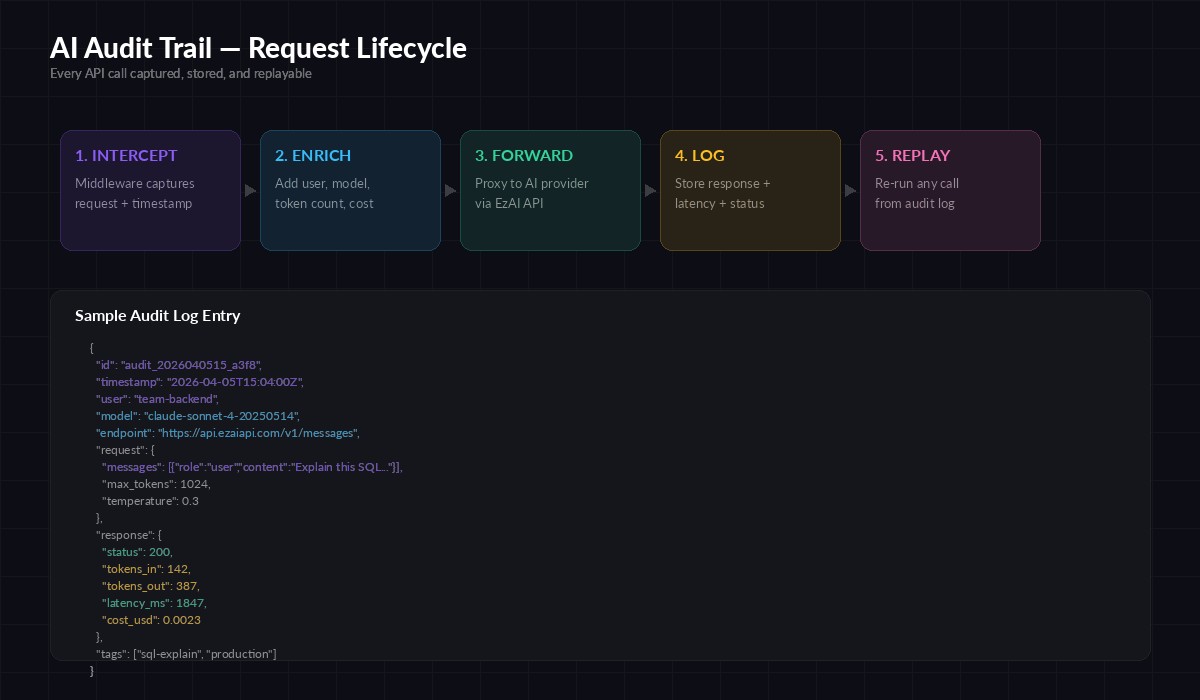
The five-stage audit pipeline: intercept → enrich → forward → log → replay
This approach keeps your business logic clean. The audit layer is invisible to callers — they use the same SDK methods, same parameters. The middleware handles timestamping, token counting, cost calculation, and persistence behind the scenes.
Python Implementation with EzAI
Here's a production-ready audit wrapper for the Anthropic SDK. It logs every call to a JSONL file with full request/response metadata:
import anthropic, json, time, uuid
from pathlib import Path

AUDIT_LOG = Path("audit_trail.jsonl")

client = anthropic.Anthropic(
    api_key="sk-your-key",
    base_url="https://api.ezaiapi.com"
)

def audited_create(user_id: str, tags: list = None, **kwargs):
    """Wrapper that logs the full request/response cycle."""
    audit_id = str(uuid.uuid4())[:12]
    start = time.monotonic()

    try:
        response = client.messages.create(**kwargs)
        latency_ms = int((time.monotonic() - start) * 1000)

        entry = {
            "id": audit_id,
            "ts": time.strftime("%Y-%m-%dT%H:%M:%SZ", time.gmtime()),
            "user": user_id,
            "model": kwargs["model"],
            "tokens_in": response.usage.input_tokens,
            "tokens_out": response.usage.output_tokens,
            "latency_ms": latency_ms,
            "status": "ok",
            "request": kwargs,
            "stop_reason": response.stop_reason,
            "tags": tags or [],
        }
    except anthropic.APIError as e:
        latency_ms = int((time.monotonic() - start) * 1000)
        entry = {
            "id": audit_id, "ts": time.strftime("%Y-%m-%dT%H:%M:%SZ", time.gmtime()),
            "user": user_id, "model": kwargs.get("model"),
            "latency_ms": latency_ms, "status": "error",
            "error": str(e), "request": kwargs,
        }
        raise
    finally:
        with AUDIT_LOG.open("a") as f:
            f.write(json.dumps(entry) + "\n")

    return response

# Usage — identical to normal SDK calls
msg = audited_create(
    user_id="backend-team",
    tags=["sql-explain", "production"],
    model="claude-sonnet-4-20250514",
    max_tokens=1024,
    messages=[{"role": "user", "content": "Explain this query: SELECT * FROM orders WHERE created_at > NOW() - INTERVAL '7 days'"}]
)
print(msg.content[0].text)
Every call now produces a JSONL line with the full context. The tags parameter lets you categorize requests for filtering later — group by feature, team, or environment.
Node.js Implementation
Same pattern in TypeScript. This version uses a class wrapper to keep the audit logic contained:
import Anthropic from "@anthropic-ai/sdk";
import { appendFileSync } from "fs";
import { randomUUID } from "crypto";

const client = new Anthropic({
  apiKey: "sk-your-key",
  baseURL: "https://api.ezaiapi.com",
});

async function auditedCreate(
  userId: string,
  params: Anthropic.MessageCreateParams,
  tags: string[] = []
) {
  const auditId = randomUUID().slice(0, 12);
  const start = Date.now();

  try {
    const response = await client.messages.create(params);
    const entry = {
      id: auditId,
      ts: new Date().toISOString(),
      user: userId,
      model: params.model,
      tokens_in: response.usage.input_tokens,
      tokens_out: response.usage.output_tokens,
      latency_ms: Date.now() - start,
      status: "ok",
      stop_reason: response.stop_reason,
      tags,
    };
    appendFileSync("audit_trail.jsonl",
      JSON.stringify(entry) + "\n");
    return response;
  } catch (err) {
    const entry = {
      id: auditId, ts: new Date().toISOString(),
      user: userId, model: params.model,
      latency_ms: Date.now() - start,
      status: "error", error: String(err),
    };
    appendFileSync("audit_trail.jsonl",
      JSON.stringify(entry) + "\n");
    throw err;
  }
}

// Usage
const msg = await auditedCreate("frontend-team", {
  model: "claude-sonnet-4-20250514",
  max_tokens: 512,
  messages: [{ role: "user", content: "Summarize this PR diff..." }],
}, ["code-review"]);
Replaying Requests from the Audit Log
The real power of an audit trail is replay. When a user reports an issue, pull the exact request from the log and re-run it — same model, same parameters, same prompt. Here's a replay utility:
import json, anthropic

client = anthropic.Anthropic(
    api_key="sk-your-key",
    base_url="https://api.ezaiapi.com"
)

def replay(audit_id: str, override_model: str = None):
    """Replay a logged request by audit ID."""
    with open("audit_trail.jsonl") as f:
        for line in f:
            entry = json.loads(line)
            if entry["id"] == audit_id:
                params = entry["request"]
                if override_model:
                    params["model"] = override_model
                return client.messages.create(**params)
    raise ValueError(f"Audit ID {audit_id} not found")

# Replay the original request
original = replay("a3f8e2b1c9d0")

# Replay against a different model for comparison
comparison = replay("a3f8e2b1c9d0", override_model="claude-opus-4-20250514")
The override_model parameter is particularly useful for regression testing. Capture requests during a stable period, then replay them against a new model version to verify output quality before switching.
Querying the Audit Log
JSONL format means you can query the log with standard Unix tools or load it into any analytics pipeline. Some useful queries:
# Total tokens by model today
cat audit_trail.jsonl | \
  jq -r 'select(.ts | startswith("2026-04-05")) |
  [.model, .tokens_in + .tokens_out] | @tsv' | \
  sort | awk '{a[$1]+=$2} END{for(k in a) print k, a[k]}'

# Requests with latency > 3 seconds
cat audit_trail.jsonl | \
  jq 'select(.latency_ms > 3000) | {id, model, latency_ms, user}'

# Error rate by user
cat audit_trail.jsonl | \
  jq -r '[.user, .status] | @tsv' | \
  sort | uniq -c | sort -rn

# Daily spend estimate (assumes Sonnet pricing)
cat audit_trail.jsonl | \
  jq 'select(.status == "ok") |
  (.tokens_in * 0.000003 + .tokens_out * 0.000015)' | \
  paste -sd+ | bc
Scaling Beyond JSONL
JSONL works for thousands of requests per day. Past that, you'll want a proper data store. The audit entry schema maps cleanly to:
- PostgreSQL with JSONB — Store the full entry in a JSONB column, add indexes on
user,model, andts. RunSELECTqueries instead ofjq. - ClickHouse — Column-oriented storage is ideal for analytical queries on token counts and costs across millions of rows.
- S3 + Athena — Dump JSONL files to S3 daily, query with Athena on demand. Cheapest option for cold storage.
Whichever backend you choose, the middleware layer stays the same. Swap out the appendFileSync call for a database insert or queue push — the rest of the code doesn't change.
Production Checklist
Before deploying your audit trail, run through these items:
- Redact sensitive data — If prompts contain PII, hash or strip it before logging. Store a reference ID so you can look up the original in your secure data store.
- Set retention policies — Audit logs grow fast. Define how long you keep full request bodies vs. metadata-only summaries.
- Async writes — Don't block API responses on log writes. Use a queue (Redis, SQS) to decouple the hot path from persistence.
- Immutability — Append-only storage. If compliance matters, use a write-once backend or cryptographic chaining to prove logs haven't been tampered with.
- Alerting — Set up alerts on error rate spikes, latency degradation, or unexpected cost jumps. Your audit log is the data source for these signals.
For a deeper dive into monitoring AI APIs in production, check out our monitoring and alerting guide. And if you're concerned about costs spiraling, the cost reduction playbook pairs well with audit trail data.
Wrapping Up
An AI audit trail isn't overhead — it's infrastructure. It turns "the AI did something weird" into "here's the exact request that triggered the issue, and here's the replay proving the fix works." Start with the JSONL wrapper above, and scale the backend as your volume grows. The middleware pattern means you add it once and every call gets logged automatically, with zero changes to your application code.
EzAI's API is fully compatible with both the Anthropic and OpenAI SDK formats, so these patterns work regardless of which models you're routing through. Grab your API key and start building your audit trail today.